


 Our Leadership Team
 Find An Advisor
 Our Platform
 Advisory
 Alternatives
 Insurance
 Specialized Services
 Individual Investors
 Retirees
 Business Owners
 Family Offices & Institutions
 Doctors
 Tenants
 Accountants
 RIA / Advisor Firms
Weekly Market Commentary
The Feds Voted to Hold Rates Steady
Posted on March 26, 2024
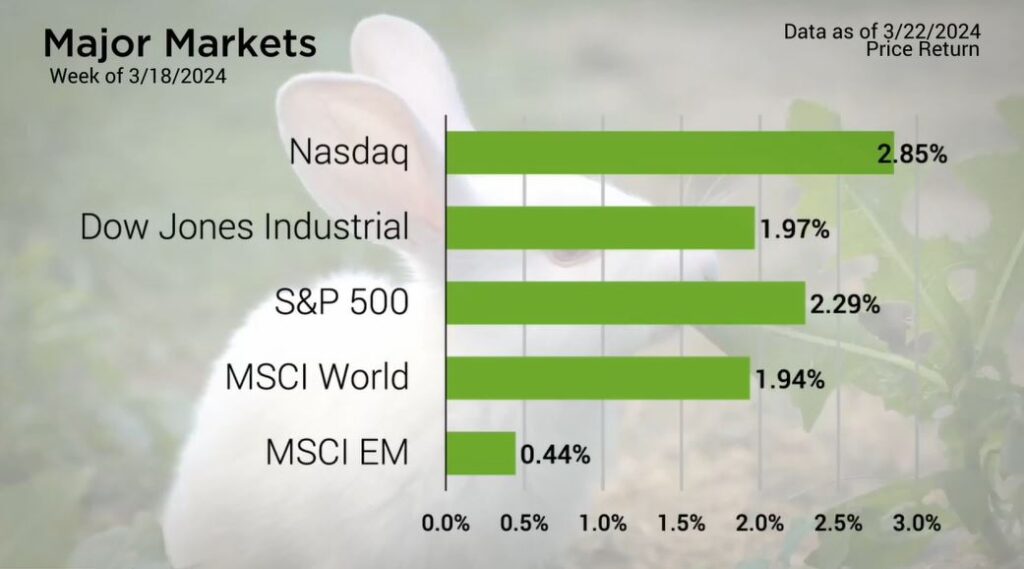
The Major Markets resumed their upward climb to all-time highs. The Nasdaq added just under three percentage points last week with the S&P 500 following not too far behind with a weekly gain of 2.29%. Going into the final week of the first quarter, these gains pushed the S&P 500 just above the Nasdaq year to date and logged a fresh all-time high in the index Thursday.
The gains were solid for most of the week with Friday being the notable exception in negative territory. Wednesday’s gains punctuated the week in large part due to the activity following the FOMC Meeting.
The meeting was more of the same from the Fed. Interest rates held steady at the 525-550 level, which was widely expected. In his prepared comments Fed Chairman Jerome Powell reiterated the committee’s ongoing commitment to a 2% inflation rate, saying:
“The Committee decided at today’s meeting to maintain the target range for the federal funds rate at 5-1/4 to 5-1/2 percent. And to continue the process of significantly reducing our securities holdings. As labor market tightens its ease and progress on inflation has continued, the risks to achieving our employment and inflation goals are coming into better balance. We believe that our policy rate is likely at its peak for this tightening cycle. In that, if the economy evolves broadly as expected, it will likely be appropriate to begin dialing back the policy restraint at some point this year. The economic outlook is uncertain however and we remain highly attentive to inflation risks. We are prepared to maintain the current target range for the federal funds rate for longer if appropriate.”
Major Markets |
YTD as of 03/22/2024 | ||
| Nasdaq |  |
||
| Dow Jones Industrial |  |
||
| S&P 500 |  |
||
| MSCI World |  |
||
| MSCI EM |  |
||
| Russell 2000 |  |
||
| Bar US Agg Bnd |  |
||
 |
|||
S&P Sectors |
|
|||||
| Comm. Services |  |
|||||
| Cons. Discretionary |  |
|||||
| Cons. Staples |  |
|||||
| Energy |  |
|||||
| Financials |  |
|||||
| Health Care |  |
|||||
| Industrials |  |
|||||
| Info. Technology |  |
|||||
| Materials |  |
|||||
| Real Estate |  |
|||||
| Utilities |  |
|||||
 |
||||||
| Agent/Broker Dealer Use Only | ||||||
Nevertheless, the market priced in the expectations of a June rate cut is the most likely upcoming initial rate adjustment with rates holding steady through the May meeting. This optimism was in large part due to the update in the Dot Plot which showed a concentration of members anticipating the target range to end around the 4.5% level by the end of 2024. This paints the picture of three 25 basis point rate cuts by the end of 2024 with additional cuts next year.
The yield curve dropped in response to this sentiment with the greatest pullback in the intermediate term of the curve.
https://www.federalreserve.gov/newsevents/pressreleases/monetary20240320a.htm
It’s tax season, and each year scammers try to take advantage of unsuspecting individuals. Check out our report on protecting your wealth.
| The S&P 500® Index is a capitalization index of 500 stock-designed to measure performance of the broad domestic economy through changes in the aggregate market value of stock representing all major industries. https://us.spindices.com/indices/equity/sp-500 The Dow Jones Industrial Average® (The Dow®), is a price-weighted measure of 30 U.S. blue-chip companies. The index covers all industries except transportation and utilities. https://us.spindices.com/indices/equity/dow-jones-industrial-average The NASDAQ Composite Index measures all NASDAQ domestic and international based common type stocks listed on The NASDAQ Stock Market. Today the NASDAQ Composite includes over 2,500 companies, more than most other stock market indexes. Because it is so broad-based, the Composite is one of the most widely followed and quoted major market indexes. https://indexes.nasdaqomx.com/Index/Overview/COMP The MSCI World Index, which is part of The Modern Index Strategy, is a broad global equity benchmark that represents large and mid-cap equity performance across 23 developed markets countries. It covers approximately 85% of the free float-adjusted market capitalization in each country and MSCI World benchmark does not offer exposure to emerging markets. The MSCI Emerging Markets (EM) Index is designed to represent the performance of large- and mid-cap securities in 24 Emerging Markets countries of the Americas, Europe, the Middle East, Africa and Asia. As of December 2017, it had more than 830 constituents and covered approximately 85% of the free float-adjusted market capitalization in each country. https://www.msci.com/ The S&P GSCI Crude Oil index provides investors with a reliable and publicly available benchmark for investment performance in the crude oil market. https://us.spindices.com/indices Companies in the S&P 500 Sector Indices are classified based on the Global Industry Classification Standard (GICS®). https://us.spindices.com/indices |


