


 Our Leadership Team
 Find An Advisor
 Our Platform
 Advisory
 Alternatives
 Insurance
 Specialized Services
 Individual Investors
 Retirees
 Business Owners
 Family Offices & Institutions
 Doctors
 Tenants
 Accountants
 RIA / Advisor Firms
Weekly Market Commentary
S&P 500 Turns Positive as Trump Delays EU Tariffs
Posted on June 4, 2025
S&P 500 Turns Positive as Trump Delays EU Tariffs
The Memorial Day trading week saw gains domestically. The week kicked off with the news that President Trump would delay the 50% tariff on the EU which was set to begin on June 1st. The import tax was delayed to July 9th after positive talks with the EU members.
Things were complicated Wednesday after the close when the U.S. Court of International Trade ruled that President Trump’s tariffs were unlawful. The White House appealed the decision which was granted by the US Court of Appeals . However, another Washington D.C. Judge blocked orders of the tariffs against a toy company. This will likely lead to a likely challenge at the Supreme Court level to ultimately sort out what extent the President can determine tariffs without Judicial interference.
Regardless, the two decisions to defer tariffs stimulated the markets. Tuesday saw the greatest gains for the week, exceeding 2 percent. Thursday’s activity was also positive, although much less so.
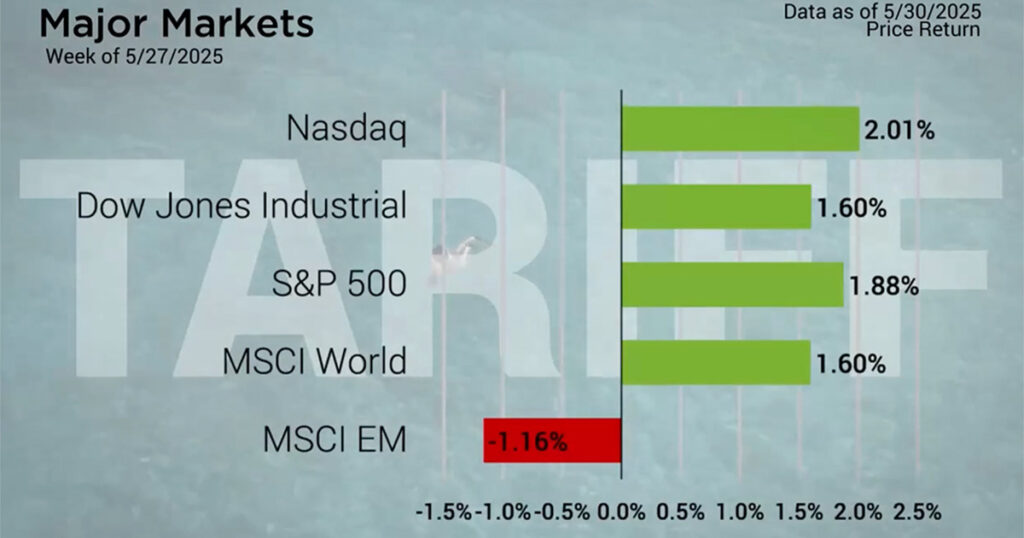
Major Markets |
YTD as of 05/23/2025 | ||
| Nasdaq |  |
||
| Dow Jones Industrial |  |
||
| S&P 500 |  |
||
| MSCI World |  |
||
| MSCI EM |  |
||
| Russell 2000 |  |
||
| Bar US Agg Bnd |  |
||
 |
|||
S&P Sectors |
|
|||||
| Comm. Services |  |
|||||
| Cons. Discretionary |  |
|||||
| Cons. Staples |  |
|||||
| Energy |  |
|||||
| Financials |  |
|||||
| Health Care |  |
|||||
| Industrials |  |
|||||
| Info. Technology |  |
|||||
| Materials |  |
|||||
| Real Estate |  |
|||||
| Utilities |  |
|||||
 |
||||||
| Agent/Broker Dealer Use Only | ||||||
The close of the week also brought the close of May. May’s gains of 6.15% marked the best monthly return since November of 2023. It also marked the best May since 1990. This activity brought the domestic markets back to nearly unchanged for the year as the S&P 500 sits with a slight positive return while the Dow and Nasdaq remain slightly negative for the year.
In other news, Treasury rates fell slightly as the intermediate to longer end of the yield curve fell by about 10 basis points. The 2-year auction seemed to perform better this week than the prior week’s 20-year which saw interest rates spike.
https://www.npr.org/2025/05/28/g-s1-69479/federal-trade-court-trump-tariffs-emergency-powers-law
High earner? Learn how a backdoor Roth IRA can help maximize your retirement savings—even if you face income limits.
| The S&P 500® Index is a capitalization index of 500 stock-designed to measure performance of the broad domestic economy through changes in the aggregate market value of stock representing all major industries. https://us.spindices.com/indices/equity/sp-500 The Dow Jones Industrial Average® (The Dow®), is a price-weighted measure of 30 U.S. blue-chip companies. The index covers all industries except transportation and utilities. https://us.spindices.com/indices/equity/dow-jones-industrial-average The NASDAQ Composite Index measures all NASDAQ domestic and international based common type stocks listed on The NASDAQ Stock Market. Today the NASDAQ Composite includes over 2,500 companies, more than most other stock market indexes. Because it is so broad-based, the Composite is one of the most widely followed and quoted major market indexes. https://indexes.nasdaqomx.com/Index/Overview/COMP The MSCI World Index, which is part of The Modern Index Strategy, is a broad global equity benchmark that represents large and mid-cap equity performance across 23 developed markets countries. It covers approximately 85% of the free float-adjusted market capitalization in each country and MSCI World benchmark does not offer exposure to emerging markets. The MSCI Emerging Markets (EM) Index is designed to represent the performance of large- and mid-cap securities in 24 Emerging Markets countries of the Americas, Europe, the Middle East, Africa and Asia. As of December 2017, it had more than 830 constituents and covered approximately 85% of the free float-adjusted market capitalization in each country. https://www.msci.com/ The S&P GSCI Crude Oil index provides investors with a reliable and publicly available benchmark for investment performance in the crude oil market. https://us.spindices.com/indices Companies in the S&P 500 Sector Indices are classified based on the Global Industry Classification Standard (GICS®). https://us.spindices.com/indices |


