


 Our Leadership Team
 Find An Advisor
 Our Platform
 Advisory
 Alternatives
 Insurance
 Specialized Services
 Individual Investors
 Retirees
 Business Owners
 Family Offices & Institutions
 Doctors
 Tenants
 Accountants
 RIA / Advisor Firms
Weekly Market Commentary
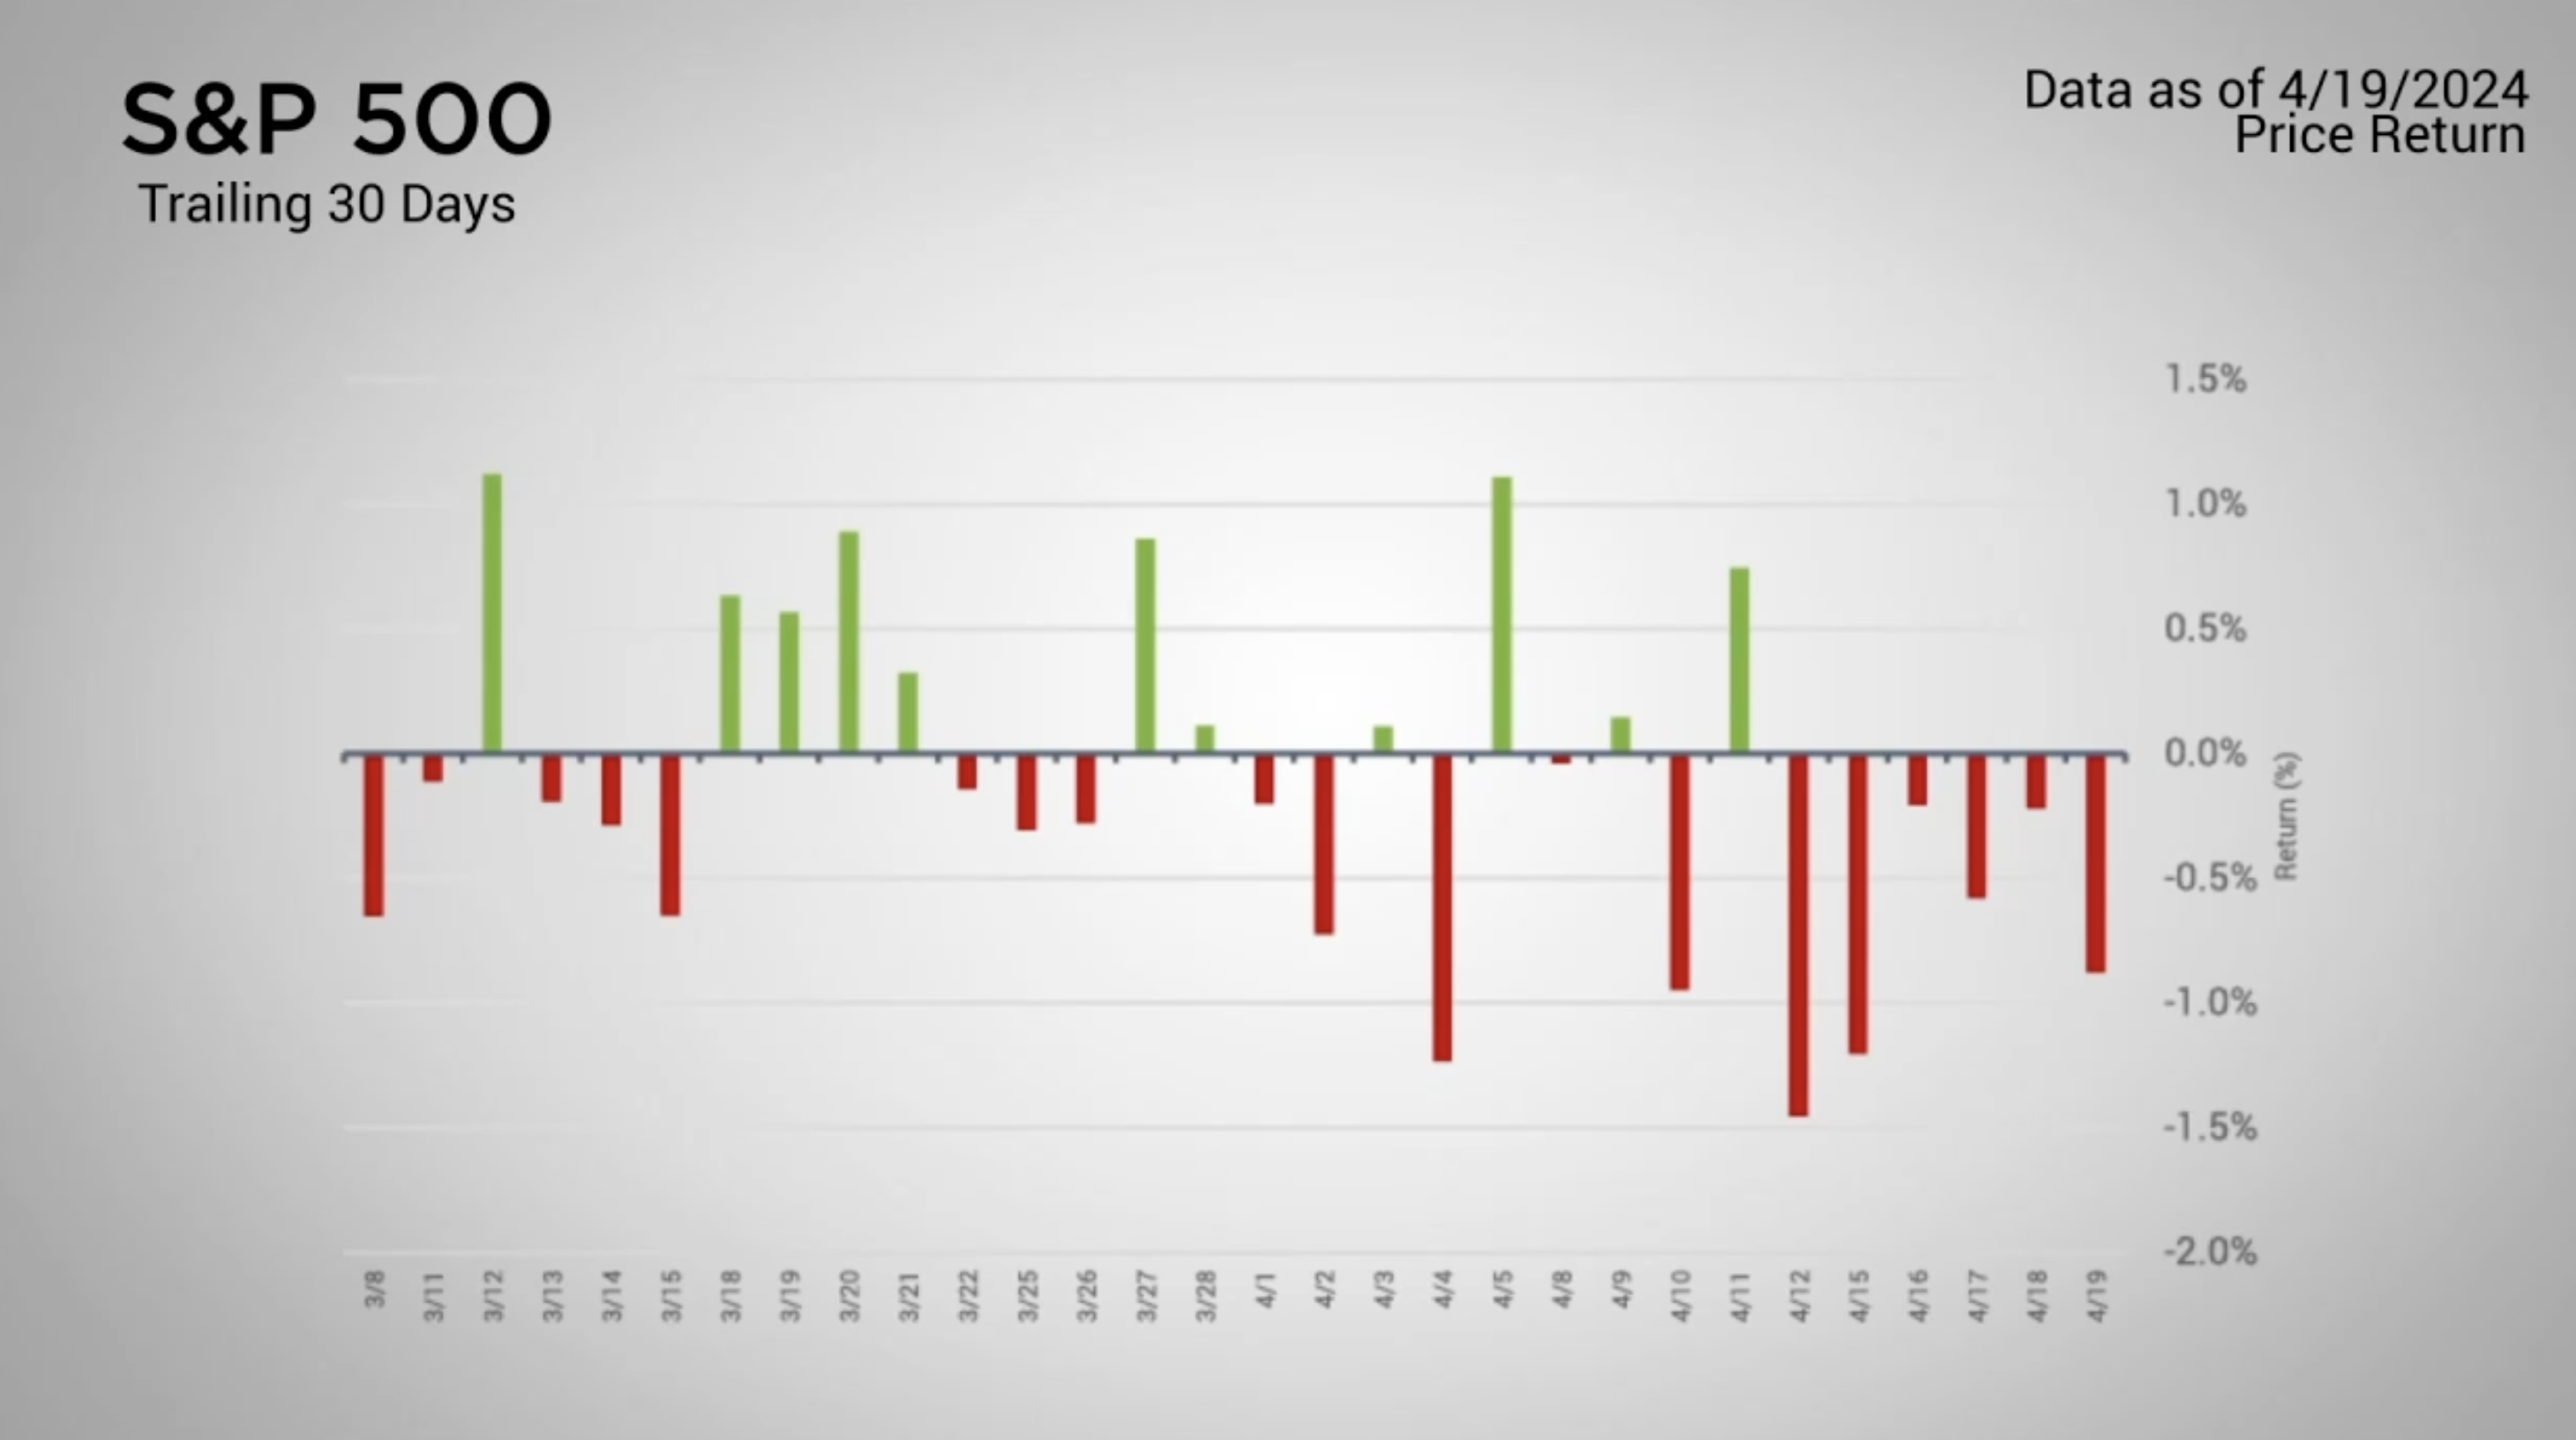
S&P 500 Sees Third Consecutive Weekly Loss
Posted on April 24, 2024
The Major Markets dropped again last week. The one exception was the Dow Jones Industrial Average which managed to close flat.
For the S&P 500, all three weeks this quarter have seen the index end with losses. Furthermore, each week has seen progressively larger losses. The last time that we saw this many consecutive weeks of losses was in September of last year when all four weeks for the month ended lower.
This downward pressure was especially visible on the daily activity. As of Friday, the last 6 days have seen net losses on the sessions. However, the last time that we’ve seen this many negative days in a row was back in October of 2022. That particular selloff also served as the bottom of 2022’s intra year losses.
There were no winners among the style boxes last week as every style box closed lower. The one general takeaway for the week was that Value outperformed Growth. Furthermore, Large Cap Value managed to end with the smallest loss.
This month’s selloff has significantly impacted the YTD returns of the style boxes.
While the large cap and much of the midcap segments have remained positive, the small cap and value sides of the styles boxes have been pulled back underwater.
Major Markets |
YTD as of 04/19/2024 | ||
| Nasdaq |  |
||
| Dow Jones Industrial |  |
||
| S&P 500 |  |
||
| MSCI World |  |
||
| MSCI EM |  |
||
| Russell 2000 |  |
||
| Bar US Agg Bnd |  |
||
 |
|||
S&P Sectors |
|
|||||
| Comm. Services |  |
|||||
| Cons. Discretionary |  |
|||||
| Cons. Staples |  |
|||||
| Energy |  |
|||||
| Financials |  |
|||||
| Health Care |  |
|||||
| Industrials |  |
|||||
| Info. Technology |  |
|||||
| Materials |  |
|||||
| Real Estate |  |
|||||
| Utilities |  |
|||||
 |
||||||
| Agent/Broker Dealer Use Only | ||||||
Market Participants have been looking to the Fed for guidance on when the eventual rate cuts will materialize. Going into this year, participants had initially anticipated the first rate cut to occur in March. However, as the year has drug on and inflation rates remained elevated, the probabilities of the first rate cut have continued to be pushed further and further down the road.
Powell stated last week that it will take “longer than expected” and that “Given the strength of the labor market and progress on inflation so far, it’s appropriate to allow restrictive policy further time to work and let the data and the evolving outlook guide us,
This continued lack of conviction around interest rate cuts has continued to push the yield curve higher. Interest rates rose again last week. As of Friday’s close, the 5 and 7-year durations of Treasuries are 45 basis points higher than the close of March.
Concerned about inflation? Check out our Tips to Reduce Risks In Case of Recession.
| The S&P 500® Index is a capitalization index of 500 stock-designed to measure performance of the broad domestic economy through changes in the aggregate market value of stock representing all major industries. https://us.spindices.com/indices/equity/sp-500 The Dow Jones Industrial Average® (The Dow®), is a price-weighted measure of 30 U.S. blue-chip companies. The index covers all industries except transportation and utilities. https://us.spindices.com/indices/equity/dow-jones-industrial-average The NASDAQ Composite Index measures all NASDAQ domestic and international based common type stocks listed on The NASDAQ Stock Market. Today the NASDAQ Composite includes over 2,500 companies, more than most other stock market indexes. Because it is so broad-based, the Composite is one of the most widely followed and quoted major market indexes. https://indexes.nasdaqomx.com/Index/Overview/COMP The MSCI World Index, which is part of The Modern Index Strategy, is a broad global equity benchmark that represents large and mid-cap equity performance across 23 developed markets countries. It covers approximately 85% of the free float-adjusted market capitalization in each country and MSCI World benchmark does not offer exposure to emerging markets. The MSCI Emerging Markets (EM) Index is designed to represent the performance of large- and mid-cap securities in 24 Emerging Markets countries of the Americas, Europe, the Middle East, Africa and Asia. As of December 2017, it had more than 830 constituents and covered approximately 85% of the free float-adjusted market capitalization in each country. https://www.msci.com/ The S&P GSCI Crude Oil index provides investors with a reliable and publicly available benchmark for investment performance in the crude oil market. https://us.spindices.com/indices Companies in the S&P 500 Sector Indices are classified based on the Global Industry Classification Standard (GICS®). https://us.spindices.com/indices |


