Weekly Market Commentary
The S&P 500 Reached a New All-Time Closing High
Posted on February 2, 2024
Larson Market Commentary
The Major Markets continued their climb higher with the S&P 500 reaching a new all-time closing high Thursday. This marks the third consecutive week higher for the S&P 500 and the 12th positive week out of the last 13.
The gains were widespread across the style boxes with both growth and value climbing higher. Furthermore, Small, Mid, and Large Cap all saw gains with the greatest gains being in Small Cap Value.
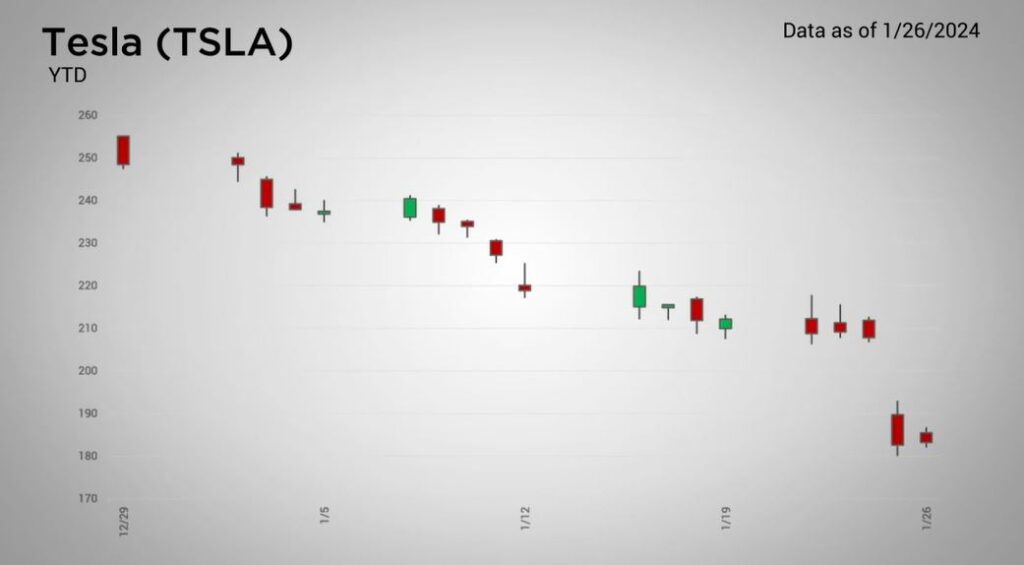
| There was some weakness in the S&P 500 Sectors as Consumer Discretionary gave back 1.4 percent with slight losses in Heath Care and Real Estate. The losses in Consumer Discretionary were due in large part to the outsized weighting of Tesla. The company stands as one of the largest holdings within the S&P 500 due to its market capitalization. Last week, the automaker dropped 13.6 percent after disappointing earnings results and forward-looking guidance. |

Major Markets |
YTD as of 01/26/2024 | ||
| Nasdaq |  |
||
| Dow Jones Industrial |  |
||
| S&P 500 |  |
||
| MSCI World |  |
||
| MSCI EM |  |
||
| Russell 2000 |  |
||
| Bar US Agg Bnd |  |
||
 |
|||
S&P Sectors |
|
|||||
| Comm. Services |  |
|||||
| Cons. Discretionary |  |
|||||
| Cons. Staples |  |
|||||
| Energy |  |
|||||
| Financials |  |
|||||
| Health Care |  |
|||||
| Industrials |  |
|||||
| Info. Technology |  |
|||||
| Materials |  |
|||||
| Real Estate |  |
|||||
| Utilities |  |
|||||
 |
||||||
| Agent/Broker Dealer Use Only | ||||||
Tesla’s earnings results was one of the first significant reports out thus far this earnings season. 441 companies reported in total last week which stands as still one of the smallest weeks for the number of companies reporting. Another 461 companies will be reporting this week with the number reaching its zenith Valentine’s week.
In economic news, Thursday’s all-time closing high coincided with the preliminary results of Q4 GDP. This number saw a 3.3 percent result, significantly higher than the 2 percent expected.
Do you own a business?
Check with your advisor to see if the Corporate Transparency Act affects you.
| The S&P 500® Index is a capitalization index of 500 stock-designed to measure performance of the broad domestic economy through changes in the aggregate market value of stock representing all major industries. https://us.spindices.com/indices/equity/sp-500 The Dow Jones Industrial Average® (The Dow®), is a price-weighted measure of 30 U.S. blue-chip companies. The index covers all industries except transportation and utilities. https://us.spindices.com/indices/equity/dow-jones-industrial-average The NASDAQ Composite Index measures all NASDAQ domestic and international based common type stocks listed on The NASDAQ Stock Market. Today the NASDAQ Composite includes over 2,500 companies, more than most other stock market indexes. Because it is so broad-based, the Composite is one of the most widely followed and quoted major market indexes. https://indexes.nasdaqomx.com/Index/Overview/COMP The MSCI World Index, which is part of The Modern Index Strategy, is a broad global equity benchmark that represents large and mid-cap equity performance across 23 developed markets countries. It covers approximately 85% of the free float-adjusted market capitalization in each country and MSCI World benchmark does not offer exposure to emerging markets. The MSCI Emerging Markets (EM) Index is designed to represent the performance of large- and mid-cap securities in 24 Emerging Markets countries of the Americas, Europe, the Middle East, Africa and Asia. As of December 2017, it had more than 830 constituents and covered approximately 85% of the free float-adjusted market capitalization in each country. https://www.msci.com/ The S&P GSCI Crude Oil index provides investors with a reliable and publicly available benchmark for investment performance in the crude oil market. https://us.spindices.com/indices Companies in the S&P 500 Sector Indices are classified based on the Global Industry Classification Standard (GICS®). https://us.spindices.com/indices |


