


 Our Leadership Team
 Find An Advisor
 Our Platform
 Advisory
 Alternatives
 Insurance
 Specialized Services
 Individual Investors
 Retirees
 Business Owners
 Family Offices & Institutions
 Doctors
 Tenants
 Accountants
Weekly Market Commentary
S&P 500 Drives Market Surge with Historic Gains
Posted on May 8, 2025
S&P 500 Drives Market Surge with Historic Gains
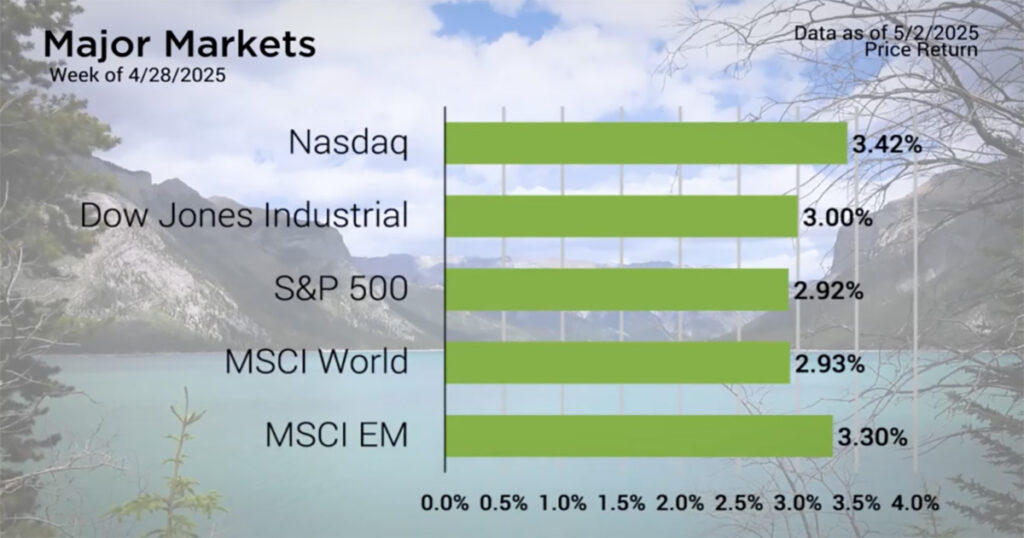
The major markets were awash in green again last week. All five indices closed higher with Emerging Markets nearly matching the gains in the Nasdaq.
For the S&P 500, the index saw nine consecutive days of gains which marked the longest winning streak in 20 years. After a 20% drop from the all-time high in early April, the recent run-up in the S&P 500 has helped to recover over half of the drawdown and now sits with a loss of 7 percent from the all-time high.
Last week was loaded with earnings and economic reports as well as optimism around tariffs and trade wars.
On the Earnings front, as of Friday, 72% of the S&P 500 names have already reported their earnings results from Q1. According to FactSet, of these companies, 76% have reported Earnings per shares above estimates, which is below the 5-year average but is still above the 10-year average.
The week was also loaded with economic reports. One which especially caught market analysts’ attention was the initial release of Q1 GDP. As the Bureau of Economic Analysis highlighted, the drop in GDP was in large part due to a surge in Imports which acts as a negative to the overall number, ahead of the tariffs taking effect.
Major Markets |
YTD as of 05/02/2025 | ||
| Nasdaq |  |
||
| Dow Jones Industrial |  |
||
| S&P 500 |  |
||
| MSCI World |  |
||
| MSCI EM |  |
||
| Russell 2000 |  |
||
| Bar US Agg Bnd |  |
||
 |
|||
S&P Sectors |
|
|||||
| Comm. Services |  |
|||||
| Cons. Discretionary |  |
|||||
| Cons. Staples |  |
|||||
| Energy |  |
|||||
| Financials |  |
|||||
| Health Care |  |
|||||
| Industrials |  |
|||||
| Info. Technology |  |
|||||
| Materials |  |
|||||
| Real Estate |  |
|||||
| Utilities |  |
|||||
 |
||||||
| Agent/Broker Dealer Use Only | ||||||
Last week, China stated that they were “currently assessing” proposals by the United States which gave indication that the country was seeking an alleviation to the current trade environment.
Treasuries saw a mid-week dip prior to the release of GDP. By Friday, the yield curve sat about 5 basis points higher than the week prior. Overall, this placed pressure on the bond market. The Bloomberg Barclays Aggregate Bond Index closed 30 basis points lower for the week as a result.
https://insight.factset.com/sp-500-earnings-season-update-may-2-2025
https://www.bea.gov/news/2025/gross-domestic-product-1st-quarter-2025-advance-estimate
https://www.cnn.com/2025/05/01/business/china-possible-trade-talks-us-tariffs-intl-hnk
High earner? Learn how a backdoor Roth IRA can help maximize your retirement savings—even if you face income limits.
| The S&P 500® Index is a capitalization index of 500 stock-designed to measure performance of the broad domestic economy through changes in the aggregate market value of stock representing all major industries. https://us.spindices.com/indices/equity/sp-500 The Dow Jones Industrial Average® (The Dow®), is a price-weighted measure of 30 U.S. blue-chip companies. The index covers all industries except transportation and utilities. https://us.spindices.com/indices/equity/dow-jones-industrial-average The NASDAQ Composite Index measures all NASDAQ domestic and international based common type stocks listed on The NASDAQ Stock Market. Today the NASDAQ Composite includes over 2,500 companies, more than most other stock market indexes. Because it is so broad-based, the Composite is one of the most widely followed and quoted major market indexes. https://indexes.nasdaqomx.com/Index/Overview/COMP The MSCI World Index, which is part of The Modern Index Strategy, is a broad global equity benchmark that represents large and mid-cap equity performance across 23 developed markets countries. It covers approximately 85% of the free float-adjusted market capitalization in each country and MSCI World benchmark does not offer exposure to emerging markets. The MSCI Emerging Markets (EM) Index is designed to represent the performance of large- and mid-cap securities in 24 Emerging Markets countries of the Americas, Europe, the Middle East, Africa and Asia. As of December 2017, it had more than 830 constituents and covered approximately 85% of the free float-adjusted market capitalization in each country. https://www.msci.com/ The S&P GSCI Crude Oil index provides investors with a reliable and publicly available benchmark for investment performance in the crude oil market. https://us.spindices.com/indices Companies in the S&P 500 Sector Indices are classified based on the Global Industry Classification Standard (GICS®). https://us.spindices.com/indices |


