


 Our Leadership Team
 Find An Advisor
 Our Platform
 Advisory
 Alternatives
 Insurance
 Specialized Services
 Individual Investors
 Retirees
 Business Owners
 Family Offices & Institutions
 Doctors
 Tenants
 Accountants
Weekly Market Commentary
Some Weakness After Back-to-Back Weeks of Gains
Posted on December 11, 2023
Larson Market Commentary
| The Major Markets closed mostly higher last week, although there was some weakness after a number of back-to-back weeks of gains. Emerging Markets fell by about ¾ of a percent while the Dow Jones Industrial Average barely managed to cross into positive territory. For the S&P 500, last week’s gains were the smallest increase out of the now sixth consecutive weeks of positive performance. That said, the blue-chip index managed to reach a new 52-week high Friday at 4609.23. |
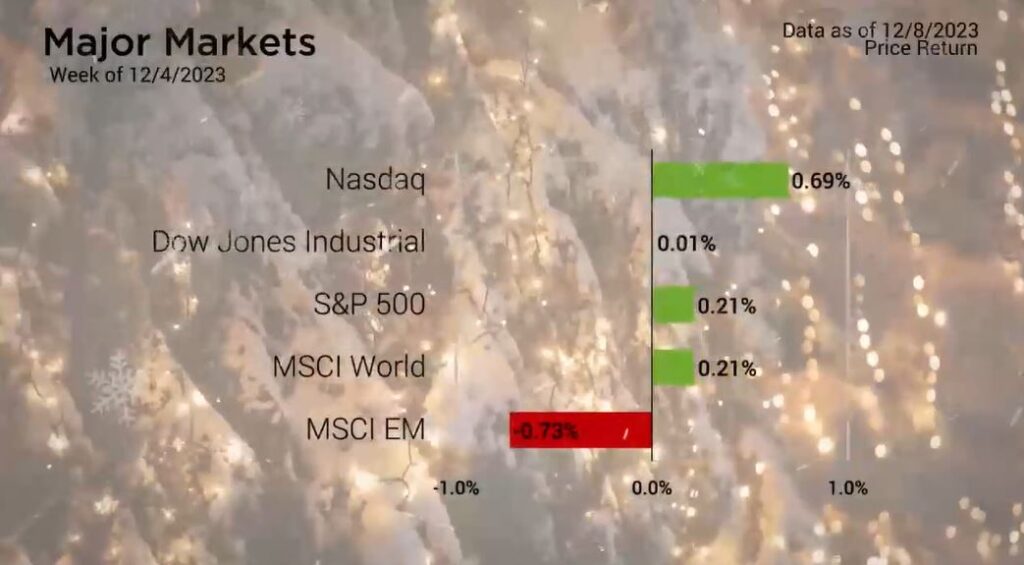
Major Markets |
YTD as of 12/08/2023 | ||
| Nasdaq |  |
||
| Dow Jones Industrial |  |
||
| S&P 500 |  |
||
| MSCI World |  |
||
| MSCI EM |  |
||
| Russell 2000 |  |
||
| Bar US Agg Bnd |  |
||
 |
|||
S&P Sectors |
|
|||||
| Comm. Services |  |
|||||
| Cons. Discretionary |  |
|||||
| Cons. Staples |  |
|||||
| Energy |  |
|||||
| Financials |  |
|||||
| Health Care |  |
|||||
| Industrials |  |
|||||
| Info. Technology |  |
|||||
| Materials |  |
|||||
| Real Estate |  |
|||||
| Utilities |  |
|||||
 |
||||||
| Agent/Broker Dealer Use Only | ||||||
While the S&P style boxes all reflected gains, even if they were minor, the Russell version of these style boxes showed how some of the segments actually ended lower.
This disparity in performance in subsectors of the markets was more visible at the sector level.
Communication Services was the standout performer with a gain of 1.4 percent, largely due to the movement from Alphabet Google and its announcement of Gemini AI at the end of last week.
Meanwhile, Energy marked the other end of the spectrum with a loss of three and a quarter percent. While this is only the second consecutive week of gains, Energy has had a number of weeks with decent sized losses in the last 12 weeks. This has been in large part the result of the drop in Oil prices which have fallen back down toward the last year’s lows.
The economic calendar was mixed again last week. The week began with a handful of service and manufacturing reports ahead of Friday’s release of the November BLS Employment Situation. This report saw the Unemployment Rate drop and more jobs created than expected.
This seemed to firm up expectations of the Fed Funds interest rate holding steady this week and through the January meeting with slightly greater odds of holding rates steady in March as a result of the continued favorable employment numbers.
Treasuries saw the yield curve steepen on Friday following the employment news. The two-year duration added 15-basis points while the 20- and 30-year duration saw the yield fall nine basis points.
Time for a financial checkup?
Click “Schedule a Consult” and get in touch today.
| The S&P 500® Index is a capitalization index of 500 stock-designed to measure performance of the broad domestic economy through changes in the aggregate market value of stock representing all major industries. https://us.spindices.com/indices/equity/sp-500 The Dow Jones Industrial Average® (The Dow®), is a price-weighted measure of 30 U.S. blue-chip companies. The index covers all industries except transportation and utilities. https://us.spindices.com/indices/equity/dow-jones-industrial-average The NASDAQ Composite Index measures all NASDAQ domestic and international based common type stocks listed on The NASDAQ Stock Market. Today the NASDAQ Composite includes over 2,500 companies, more than most other stock market indexes. Because it is so broad-based, the Composite is one of the most widely followed and quoted major market indexes. https://indexes.nasdaqomx.com/Index/Overview/COMP The MSCI World Index, which is part of The Modern Index Strategy, is a broad global equity benchmark that represents large and mid-cap equity performance across 23 developed markets countries. It covers approximately 85% of the free float-adjusted market capitalization in each country and MSCI World benchmark does not offer exposure to emerging markets. The MSCI Emerging Markets (EM) Index is designed to represent the performance of large- and mid-cap securities in 24 Emerging Markets countries of the Americas, Europe, the Middle East, Africa and Asia. As of December 2017, it had more than 830 constituents and covered approximately 85% of the free float-adjusted market capitalization in each country. https://www.msci.com/ The S&P GSCI Crude Oil index provides investors with a reliable and publicly available benchmark for investment performance in the crude oil market. https://us.spindices.com/indices Companies in the S&P 500 Sector Indices are classified based on the Global Industry Classification Standard (GICS®). https://us.spindices.com/indices |


