




 Our Leadership Team
 Find An Advisor
 Our Platform
 Advisory
 Alternatives
 Insurance
 Specialized Services
 Individual Investors
 Retirees
 Business Owners
 Family Offices & Institutions
 Doctors
 Tenants
 Accountants
 RIA / Advisor Firms
News
Markets in Tension
Posted on September 22, 2026

Monthly Market Commentary
September 2026
“The test of a first-rate intelligence is the ability to hold two opposed ideas in mind at the same time.”
– F. Scott Fitzgerald
Market Recap: Competing Signals
As summer began to wind down, markets continued their upward trend in August. The Nasdaq gained 3.9%, the S&P 500 rose 2.7%, and the Dow advanced 1.3%, supported by strong corporate earnings, continued AI investment, and an economy that remained more resilient than expected.[1][2]
| Market | August | 2026 YTD |
| S&P 500 | +2.62% | +12.28% |
| Nasdaq Composite | +3.93% | +13.46% |
| Dow Industrials | +1.34% | +10.66% |
| 10-year Treasury Yield (Level) | 4.75% | +59 bps YTD |
| WTI crude oil | +2.01% | +49.98% |
| Gold futures | +9.56% | +4.00% |
Source: MMBB, Monthly Market Review, August 2026. Market data through August 31, 2026. [1]
Elevated Yields
The market’s strength was accompanied by elevated borrowing costs. The 10-year Treasury yield held near 4.75%, while the 30-year briefly reached 5.33% amid persistent concerns about inflation and the U.S. fiscal outlook.[3] The major development came on August 19, when Treasury Secretary Scott Bessent announced an expansion of the Treasury’s long-term bond-buyback program, doubling the maximum size of certain purchases from $2 billion to at least $4 billion per operation.[4] Although the announcement briefly pushed yields lower, the effect faded the following day.[17] Yields continued to climb as lingering anxieties over the mounting national debt and persistent fiscal deficits quickly pushed borrowing costs back to elevated levels.
Historical 10-Year US Treasury Yield
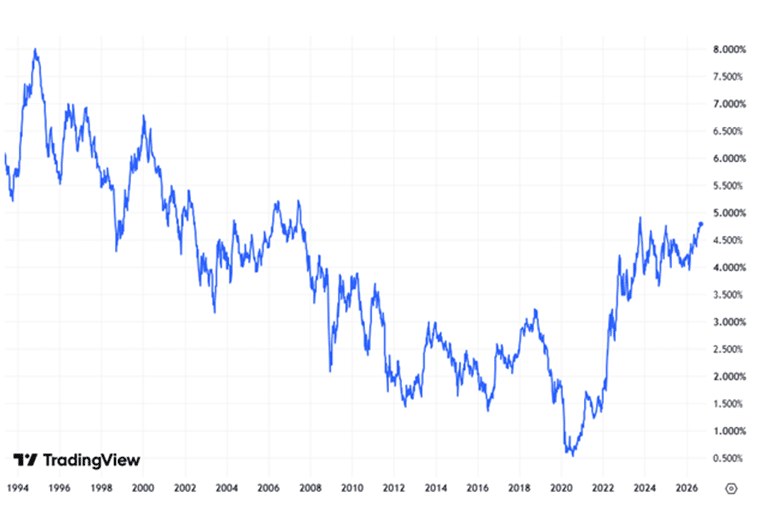
Source: TradingView, U.S. 10-year Treasury yield chart, accessed September 8, 2026 [16]
Fed Chair Kevin Warsh emphasized inflation as the central concern at the Federal Reserve’s annual Jackson Hole symposium, signaling that policymakers were in no hurry to change rates before receiving additional economic information.[5] His remarks pushed markets away from expectations for easing and raised the possibility that monetary policy could remain restrictive or even tighten further. That caution comes as the U.S. economy continues to demonstrate resilience, supported by moderate growth and a healthy labor market. The August employment report, which showed the economy adding 162,000 nonfarm jobs [6], provided another example of that underlying strength. While resilient economic data is constructive for consumer spending and corporate earnings, it also reduces the urgency for the Fed to cut rates. If economic growth and employment remain firm while inflation stays elevated, policymakers may be compelled to keep interest rates higher for longer or potentially raise them further. So, this means investors who began the year anticipating rate cuts are now recalibrating as inflationary pressures persist alongside moderate economic growth. We will closely monitor the Fed’s September meeting for any change in monetary policy. The CME FedWatch Tool currently indicates that markets are assigning a meaningful probability for a rate increase at September’s Fed meeting.[7]
Strong Equity Markets
Equities and higher yields were able to coexist because investors believed earnings could continue absorbing the pressure from a rising cost of capital. This belief appeared to have been rewarded as the AI investment cycle continued to drive earnings higher. Beyond any individual result, the broader message of strong corporate profits remained intact.[8] Looking ahead, the central question remains as to whether profits can continue outrunning the pressure of higher rates – earnings carried the argument for equities in August, but continued execution will be necessary if bond yields remain elevated.
International markets reflected a similar tension between earnings support and rising policy constraints. Japan led major equity markets with a 3.9% August gain, as Japanese exporters benefited from a weakening yen beyond 160 per U.S. dollar, but the currency’s decline also increased inflation concerns and speculation that authorities could intervene.[9] Emerging-market gains were supported by continued AI-related semiconductor demand in South Korea and Taiwan, while Europe excluding the U.K. gained 0.7% and U.K. equities rose 0.7%.
Sector leadership captured August’s central contradiction: investors continued favoring growth and cyclical exposure even as higher oil prices and interest rates increased the risks surrounding that growth. Energy was the strongest-performing sector, with the S&P 500 Energy sector gaining 7.4%, as renewed U.S.-Iran tensions near the Strait of Hormuz pushed Brent crude above $90. Higher energy prices have improved the earnings outlook for energy producers, but it also threatened to lift inflation, pressure consumers, and complicate any shift toward easier Fed policy. Technology followed with a 6.4% gain, demonstrating that investors remained willing to embrace growth despite higher yields. Meanwhile, Utilities declined 4.8%, reflecting pressure on a capital-intensive sector whose dividends faced greater competition from Treasury yields.[10][11] Taken together, sector performance showed that investors remained positioned offensively, even as the cost of capital and geopolitical risks continued to rise.
Within real assets, precious metals and digital assets were the real standouts in August. Gold futures surged 9.6% to $4,497, even as real yields remained elevated, while the U.S. Dollar Index declined 0.4%.[2] Bitcoin rose approximately 24% during the month, climbing from roughly $63,000 to nearly $78,000 and briefly crossing $80,000 for the first time since May.[12] Although gold and digital assets differ significantly in their risks and methods of valuation, their simultaneous strength suggested growing demand for assets outside traditional currencies and government debt. Investors were not abandoning risk; they were maintaining growth exposure while also seeking protection against fiscal concerns, dollar weakness, and geopolitical instability.
Renewed Geopolitical Tensions and Election Perspectives
As noted above, renewed U.S.–Iran tensions added another layer of complexity to the market outlook. The conflict provided a tailwind for energy stocks, but it also increased the risk of prolonged oil-supply disruptions, higher transportation costs, and renewed inflationary pressure throughout the broader economy. Those risks were reflected in August’s CPI report, which showed headline inflation holding steady at 3.4% year-over-year (up 0.3% month-over-month).[14] The economic consequences also extend into the political arena: elevated fuel prices and persistent inflation significant issue for incumbents and candidates as voters evaluate cost-of-living pressures ahead of November’s midterm elections. Once again, the conflict illustrates the market’s underlying tension, supporting energy sector earnings on one side while pressuring consumers, complicating the Federal Reserve’s policy path, and increasing political uncertainty on the other.
Midterm elections could add another layer of tension to an already complicated market backdrop. With control of both chambers potentially resting on narrow margins, investors must consider several possible paths for taxes, regulation, spending, and government borrowing. Changes in spending or fiscal policy could also influence the government-borrowing concerns already placing upward pressure on Treasury yields. That uncertainty can increase volatility as polling and prediction markets shift. History, however, suggests that the volatility surrounding midterms has typically been temporary. Our research shows that the S&P 500 has produced a positive return in the year following every midterm election since 1953. Returns have historically been choppier during the summer before strengthening around Election Day and into year-end.[15] This supports the idea of staying invested and not playing politics with your portfolio. While that pattern does not guarantee a similar outcome in 2026, it reinforces a broader lesson: markets have historically responded more favorably to the resolution of uncertainty than to any particular party winning.
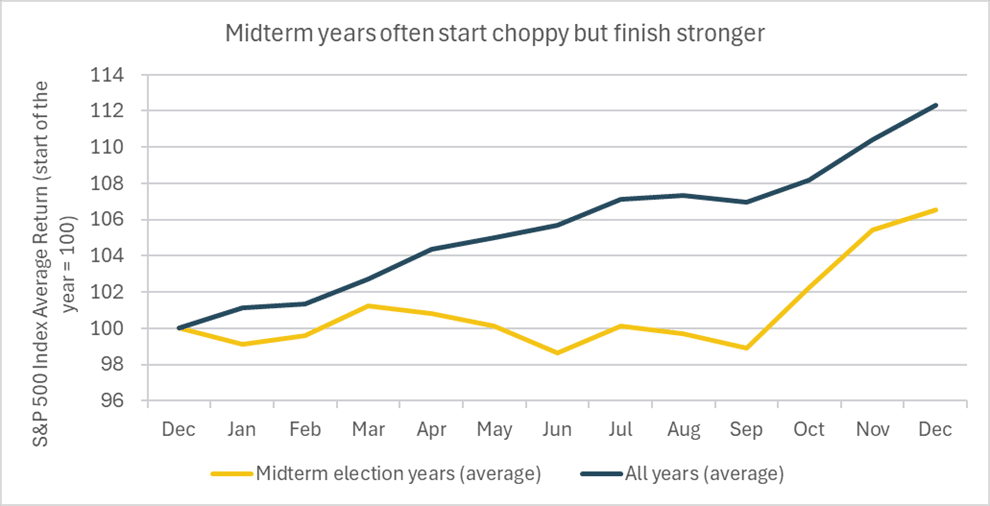
Source: Bloomberg Finance L.P. and Larson Investments. Illustrative average monthly paths cover 1953-2025, assume reinvestment of dividends, and exclude fees and taxes. Past performance does not guarantee future results. [15]
Closing Thoughts
August rewarded investors who could hold competing ideas without forcing them into a single forecast. Equity gains and record highs were supported by real earnings strength. Elevated yields were also justified by inflation risk, issuance, and durable demand for capital. AI can potentially raise productivity and corporate profits while simultaneously increasing near-term demand for power and financing. The U.S.-Iran conflict can support energy earnings while simultaneously raising inflation, pressuring consumers, and keeping the Fed cautious. Midterm uncertainty can generate volatility even when long-run market history remains constructive. In line with our mid-year outlook, we remain cautiously optimistic for the market outlook but note the potential for elevated volatility in the months to come. We’ll continue to closely monitor the Federal Reserve’s September decision and updated economic projections, along with inflation, employment, and consumer-spending data for evidence that growth is either cooling or reaccelerating. As always, if you have any questions or would like to talk about what this could mean for your portfolio we’re here to help.[5][6][7][14]
Sources
[1] MMBB, Monthly Market Review, August 2026
[2] S&P Dow Jones Indices, U.S. Dashboard, August 31, 2026
[3] U.S. Department of the Treasury, Daily Treasury Par Yield Curve Rates
[4] U.S. Treasury, Increased Long-End Liquidity-Support Buybacks, August 19, 2026
[5] Federal Reserve Board, Keynote Remarks by Chairman Kevin Warsh at Jackson Hole, August 28, 2026
[6] U.S. Bureau of Labor Statistics, Employment Situation – August 2026, September 4, 2026
[7] CME Group, September Rate-Hike Probabilities, September 9, 2026
[8] FactSet, Earnings Insight, August 28, 2026
[9] Janus Henderson Investors, Market Moves and Themes That Mattered, August 2026
[10] YCharts, Select Sector SPDR ETF adjusted-close returns, July 31-August 31, 2026
[11] J.P. Morgan Asset Management, Review of Markets Over August 2026.[2] S&P Dow Jones Indices, U.S. Dashboard, August 31, 2026
[14] U.S. Bureau of Labor Statistics, Consumer Price Index – August 2026, September 11, 2026
[15] Larson Financial, 2026 Election Market Monitor, client-provided research; underlying data from Bloomberg Finance L.P.
[16] TradingView, U.S. 10-year Treasury yield chart, accessed September 8, 2026
[17] Reuters, Bonds Bounce on U.S. Buybacks, but Relief May Be Brief, August 20, 2026
Data Notes
Market levels and returns are rounded. Unless otherwise stated, market data are measured through August 31, 2026. The S&P 500 figure in the narrative is rounded from the S&P total-return series; the table uses the MMBB price-index calculation.
Treasury yields are percentages; yield changes are expressed in basis points. Futures returns use the applicable front-month contract. Digital assets trade continuously, so monthly returns and price levels can vary by exchange and cutoff time.
The September FedWatch probability is a market-implied estimate derived from federal-funds futures, not a Federal Reserve forecast. Election-cycle averages are historical observations and are not forecasts or guarantees of future performance.


