


 Our Leadership Team
 Find An Advisor
 Our Platform
 Advisory
 Alternatives
 Insurance
 Specialized Services
 Individual Investors
 Retirees
 Business Owners
 Family Offices & Institutions
 Doctors
 Tenants
 Accountants
Weekly Market Commentary
Second Quarter Stumbles Amid Employment Surprises
Posted on April 9, 2024
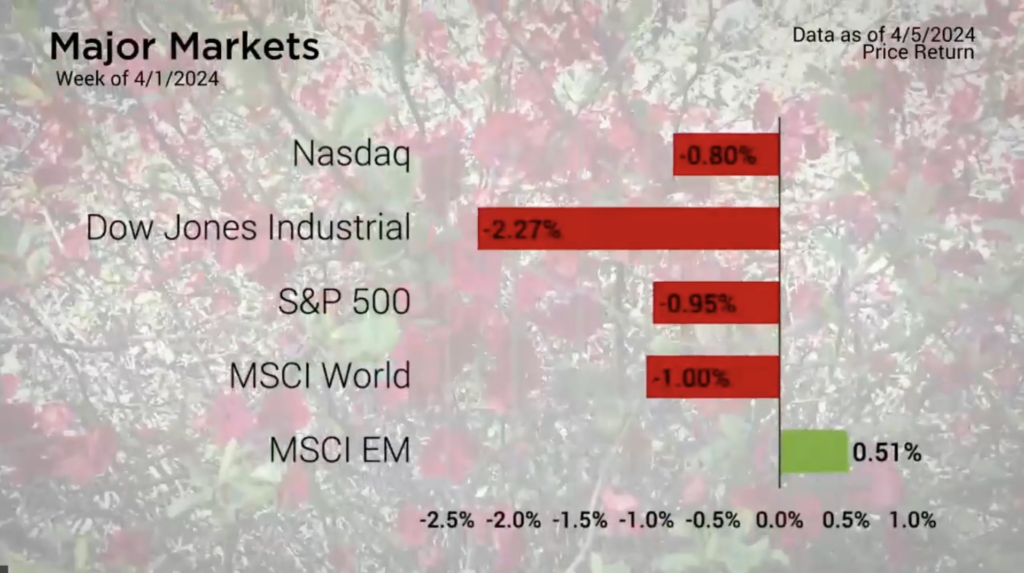
The 2nd quarter fumbled out of the gate with losses in four out of the five major markets. The more heavily concentrated Dow Jones Industrial Average especially felt the brunt of the losses last week with a drop of 2.27%.
The week began with selling which seemed to become more pronounced each day the market closed lower. Wednesday served as a midweek respite to the selling before it resumed with greater fervor Thursday and recovered slightly Friday.
The week ended with the release of the March BLS Employment Report. The headline number blew past estimates on the street with a reading of 303,000 jobs added. This was over 100,000 more than anticipated. That said, when looking at the numbers below the headlines, we see that the number of people working part-time jobs increased by 691,000 while the number of people working fulltime jobs actually dropped by 6,000. This employment characteristic seemingly belied the headline number, giving the markets positive news, yet a fair amount of caution as well.
The employment numbers have continued to be surprisingly resilient despite the elevated interest rate environment. The other economic indicators earlier in the week also came in generally positive which makes cutting interest rates a bit of a challenge for the Federal Reserve as they do not want to take action too early and risk additional inflationary risk
Major Markets |
YTD as of 04/05/2024 | ||
| Nasdaq |  |
||
| Dow Jones Industrial |  |
||
| S&P 500 |  |
||
| MSCI World |  |
||
| MSCI EM |  |
||
| Russell 2000 |  |
||
| Bar US Agg Bnd |  |
||
 |
|||
S&P Sectors |
|
|||||
| Comm. Services |  |
|||||
| Cons. Discretionary |  |
|||||
| Cons. Staples |  |
|||||
| Energy |  |
|||||
| Financials |  |
|||||
| Health Care |  |
|||||
| Industrials |  |
|||||
| Info. Technology |  |
|||||
| Materials |  |
|||||
| Real Estate |  |
|||||
| Utilities |  |
|||||
 |
||||||
| Agent/Broker Dealer Use Only | ||||||
Minneapolis Fed President Neal Kashkari, a non-voting Fed member, went so far as to verbalize this saying
“If we continue to see inflation moving sideways, then that would make me question whether we need to do those rate cuts at all,”
This hawkishness around the rate cuts was a blow to market participants who came into this year anticipating multiple rate cuts. The CME Group Fed Watch tool still has priced in multiple rate cuts this year with the most likely cut projected to take place in June.
Treasuries saw the yield curve rise in response. The long-term end of the yield curve rose the greatest as the 20 and 30-year duration added 20 basis points.
This action in turn hit the bond markets which saw widespread red. As a result, the Bloomberg Barclays Aggregate Bond Index gave back over a percentage point.
It’s tax season, and each year scammers try to take advantage of unsuspecting individuals. Check out our report on protecting your wealth.
| The S&P 500® Index is a capitalization index of 500 stock-designed to measure performance of the broad domestic economy through changes in the aggregate market value of stock representing all major industries. https://us.spindices.com/indices/equity/sp-500 The Dow Jones Industrial Average® (The Dow®), is a price-weighted measure of 30 U.S. blue-chip companies. The index covers all industries except transportation and utilities. https://us.spindices.com/indices/equity/dow-jones-industrial-average The NASDAQ Composite Index measures all NASDAQ domestic and international based common type stocks listed on The NASDAQ Stock Market. Today the NASDAQ Composite includes over 2,500 companies, more than most other stock market indexes. Because it is so broad-based, the Composite is one of the most widely followed and quoted major market indexes. https://indexes.nasdaqomx.com/Index/Overview/COMP The MSCI World Index, which is part of The Modern Index Strategy, is a broad global equity benchmark that represents large and mid-cap equity performance across 23 developed markets countries. It covers approximately 85% of the free float-adjusted market capitalization in each country and MSCI World benchmark does not offer exposure to emerging markets. The MSCI Emerging Markets (EM) Index is designed to represent the performance of large- and mid-cap securities in 24 Emerging Markets countries of the Americas, Europe, the Middle East, Africa and Asia. As of December 2017, it had more than 830 constituents and covered approximately 85% of the free float-adjusted market capitalization in each country. https://www.msci.com/ The S&P GSCI Crude Oil index provides investors with a reliable and publicly available benchmark for investment performance in the crude oil market. https://us.spindices.com/indices Companies in the S&P 500 Sector Indices are classified based on the Global Industry Classification Standard (GICS®). https://us.spindices.com/indices |


