


 Our Leadership Team
 Find An Advisor
 Our Platform
 Advisory
 Alternatives
 Insurance
 Specialized Services
 Individual Investors
 Retirees
 Business Owners
 Family Offices & Institutions
 Doctors
 Tenants
 Accountants
 RIA / Advisor Firms
Weekly Market Commentary
Price Increases in Crude Oil and Natural Gas
Posted on September 5, 2023
Market Commentary by Mitchell Wood, Larson COO
| The Major Markets closed out the unofficial end of summer with gains in all five indices. The last few days of August helped to recoup much of the month’s early losses, as the S&P 500 closed the month down only 1.7 percent. The gains in the equity market were fueled in large part by the fall in interest rates. Treasuries dropped a fair amount in the short to intermediate durations. The greatest decrease in yield was in the 2-year duration, which fell 16 basis points. As a result, Bond indices also added green across much of the debt market. The positive performance was consistent across the style boxes with each segment adding over two percentage points. This theme was largely true at the Sector level as only two of the 11 sectors closed lower. The greatest gains were in the Information Technology sector which brought most of the gains for the NASDAQ Composite. |
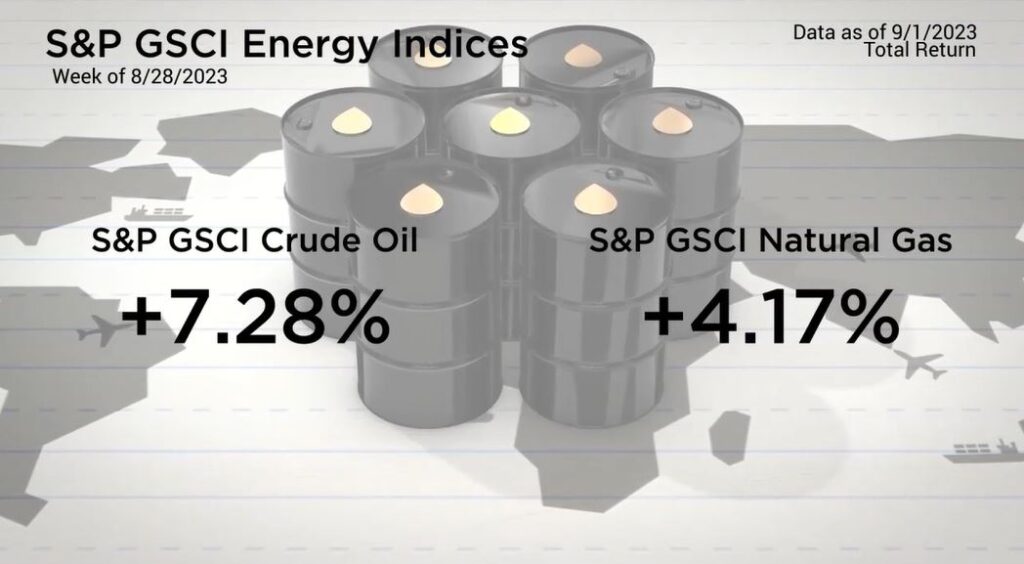
| Energy was not too far behind with a gain of 3.78 percent. The positive performance of the Energy sector was attributed to the price increases in Crude Oil and Natural Gas. Crude Oil prices have traded in a fairly large range with the lows of the last year being set in March and then retested in June. |
However, since late June, Crude Oil prices have traded mostly higher with an early August dip that coincided with the equity market.
| The increases in Oil gave some analysts pause as the higher prices raised concerns about enduring inflation. Last week’s economic reports had mixed results. Job Openings fell to 8.8M, down from the prior month’s 9.2M and substantially lower than the 9.5M expected. Q2 GDP was revised lower from 2.4 percent to 2.1 percent. Both reports implied weakness in the economy. However, the BLS employment Situations was not quite so clear. Total new nonfarm payrolls for August beat expectations with a reading of 187,000. Meanwhile, every prior month was revised lower with June now reflecting a paltry 105,000 compared to the 209,000 initially reported. Furthermore, the Unemployment rate rose to 3.8 percent, which was substantially higher than the 3.5 percent from July that was also expected for August. The economic calendar will be fairly light this week, especially with participants taking a rest on Labor Day. |
Have a question for your advisor?
Click “Schedule a Consult” and get in touch today.
| The S&P 500® Index is a capitalization index of 500 stock-designed to measure performance of the broad domestic economy through changes in the aggregate market value of stock representing all major industries. https://us.spindices.com/indices/equity/sp-500 The Dow Jones Industrial Average® (The Dow®), is a price-weighted measure of 30 U.S. blue-chip companies. The index covers all industries except transportation and utilities. https://us.spindices.com/indices/equity/dow-jones-industrial-average The NASDAQ Composite Index measures all NASDAQ domestic and international based common type stocks listed on The NASDAQ Stock Market. Today the NASDAQ Composite includes over 2,500 companies, more than most other stock market indexes. Because it is so broad-based, the Composite is one of the most widely followed and quoted major market indexes. https://indexes.nasdaqomx.com/Index/Overview/COMP The MSCI World Index, which is part of The Modern Index Strategy, is a broad global equity benchmark that represents large and mid-cap equity performance across 23 developed markets countries. It covers approximately 85% of the free float-adjusted market capitalization in each country and MSCI World benchmark does not offer exposure to emerging markets. The MSCI Emerging Markets (EM) Index is designed to represent the performance of large- and mid-cap securities in 24 Emerging Markets countries of the Americas, Europe, the Middle East, Africa and Asia. As of December 2017, it had more than 830 constituents and covered approximately 85% of the free float-adjusted market capitalization in each country. https://www.msci.com/ The S&P GSCI Crude Oil index provides investors with a reliable and publicly available benchmark for investment performance in the crude oil market. https://us.spindices.com/indices Companies in the S&P 500 Sector Indices are classified based on the Global Industry Classification Standard (GICS®). https://us.spindices.com/indices |


