


 Our Leadership Team
 Find An Advisor
 Our Platform
 Advisory
 Alternatives
 Insurance
 Specialized Services
 Individual Investors
 Retirees
 Business Owners
 Family Offices & Institutions
 Doctors
 Tenants
 Accountants
Weekly Market Commentary
The Possibility of a March Rate Cut Decreases
Posted on February 21, 2024
Larson Market Commentary
It was a mixed week last week as the Major Markets saw a range of positive and negative returns. The domestic market generally saw a pullback, as evidenced by the Major Markets. However, when we dig deeper, we see that the losses were mostly isolated to the large cap segments while the value and small and mid-cap components still managed to climb higher.
This contrast was also visible at the sector level. Only 4 out of the 11 sectors closed lower. However, due to the weighting of the S&P 500 and the significance of the losses, the overall S&P 500 fell 42 basis points.
| The greatest losses were in Information Technology and Communication Services, two sectors that have a significant presence within the NASDAQ and accounted for most of the weekly losses. Tuesday saw the greatest losses for the week with a drop of 1.37 percent for the S&P 500. This pullback came on the heels of the release of the January Consumer Price Index. The monthly increase of .4 percent was hotter than expected with a year-over-year increase of 3.1 percent. While this was still a step down in terms of December’s year-over-year increase, it was 0.2 percent higher than expectations. |
Major Markets |
YTD as of 02/16/2024 | ||
| Nasdaq |  |
||
| Dow Jones Industrial |  |
||
| S&P 500 |  |
||
| MSCI World |  |
||
| MSCI EM |  |
||
| Russell 2000 |  |
||
| Bar US Agg Bnd |  |
||
 |
|||
S&P Sectors |
|
|||||
| Comm. Services |  |
|||||
| Cons. Discretionary |  |
|||||
| Cons. Staples |  |
|||||
| Energy |  |
|||||
| Financials |  |
|||||
| Health Care |  |
|||||
| Industrials |  |
|||||
| Info. Technology |  |
|||||
| Materials |  |
|||||
| Real Estate |  |
|||||
| Utilities |  |
|||||
 |
||||||
| Agent/Broker Dealer Use Only | ||||||
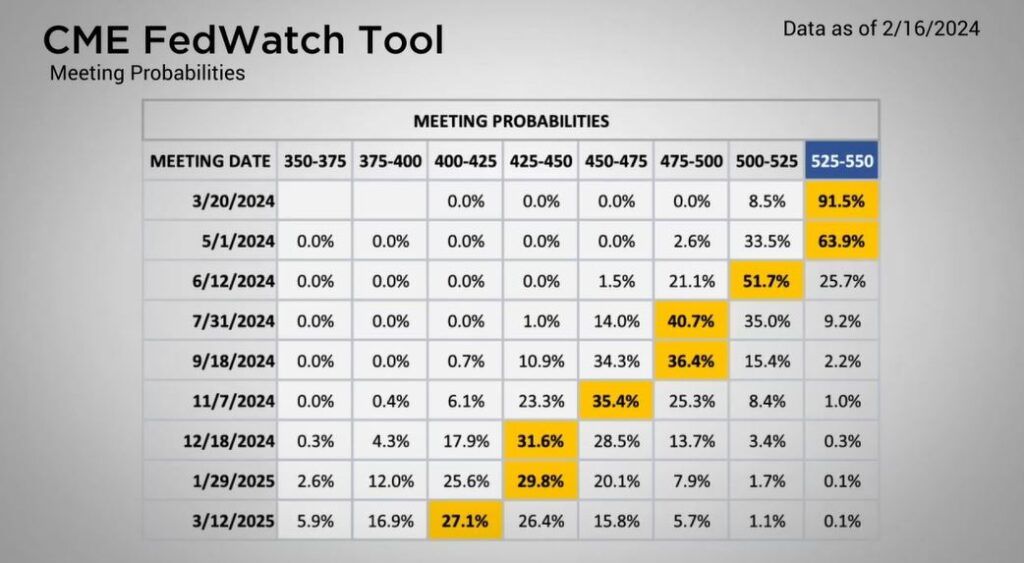
This caused the probabilities of a March rate cut to fall further. As of Friday’s close, the probability of the Fed Funds Rate to hold steady at 525-550 basis points climbed up to 91.5 percent, significantly higher than the 45.5 percent chance that was priced into the markets at the end of January.
Wednesday and Thursday managed to climb higher following the earlier selloff. The bellow estimate jobless claims and US Retail Sales helped to temper the CPI print with the market returning back to positive for the week by Thursday’s close. Friday’s roughly half a percent loss encapsulated the losses for the week.
The waning optimism of a March rate cut sent the yield curve higher. This in turn pulled the bond market down for the week.
Do you own a business?
Check with your advisor to see if the Corporate Transparency Act affects you.
| The S&P 500® Index is a capitalization index of 500 stock-designed to measure performance of the broad domestic economy through changes in the aggregate market value of stock representing all major industries. https://us.spindices.com/indices/equity/sp-500 The Dow Jones Industrial Average® (The Dow®), is a price-weighted measure of 30 U.S. blue-chip companies. The index covers all industries except transportation and utilities. https://us.spindices.com/indices/equity/dow-jones-industrial-average The NASDAQ Composite Index measures all NASDAQ domestic and international based common type stocks listed on The NASDAQ Stock Market. Today the NASDAQ Composite includes over 2,500 companies, more than most other stock market indexes. Because it is so broad-based, the Composite is one of the most widely followed and quoted major market indexes. https://indexes.nasdaqomx.com/Index/Overview/COMP The MSCI World Index, which is part of The Modern Index Strategy, is a broad global equity benchmark that represents large and mid-cap equity performance across 23 developed markets countries. It covers approximately 85% of the free float-adjusted market capitalization in each country and MSCI World benchmark does not offer exposure to emerging markets. The MSCI Emerging Markets (EM) Index is designed to represent the performance of large- and mid-cap securities in 24 Emerging Markets countries of the Americas, Europe, the Middle East, Africa and Asia. As of December 2017, it had more than 830 constituents and covered approximately 85% of the free float-adjusted market capitalization in each country. https://www.msci.com/ The S&P GSCI Crude Oil index provides investors with a reliable and publicly available benchmark for investment performance in the crude oil market. https://us.spindices.com/indices Companies in the S&P 500 Sector Indices are classified based on the Global Industry Classification Standard (GICS®). https://us.spindices.com/indices |


