


 Our Leadership Team
 Find An Advisor
 Our Platform
 Advisory
 Alternatives
 Insurance
 Specialized Services
 Individual Investors
 Retirees
 Business Owners
 Family Offices & Institutions
 Doctors
 Tenants
 Accountants
Weekly Market Commentary
One Last Week of Gains for 2023
Posted on January 4, 2024
Larson Market Commentary
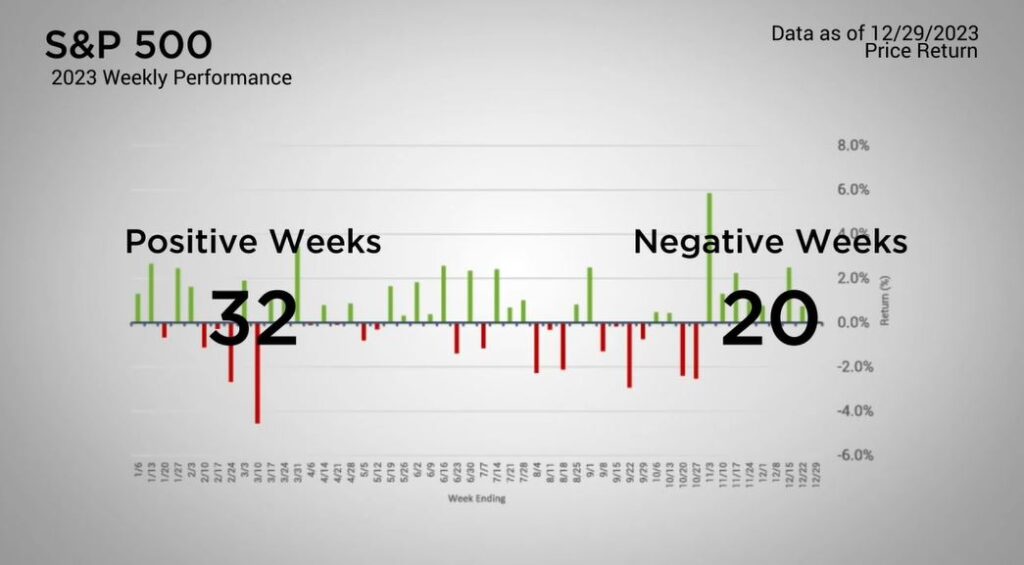
| The Major Markets closed out 2023 with one last week of gains. For the S&P 500, this marked the ninth consecutive week of advances. This is the longest stretch of positive performance for the S&P 500 since 2004. That said, last week’s gains of just under a third of a percent was the second smallest gain for the year. 2023 had a total of 32 positive weeks and 20 weeks with losses. Altogether, the S&P 500 closed out the year with a gain of 24.23 percent. This was second to the Nasdaq which added an impressive 43.42 percent return for the year. |
Major Markets |
YTD as of 12/29/2023 | ||
| Nasdaq |  |
||
| Dow Jones Industrial |  |
||
| S&P 500 |  |
||
| MSCI World |  |
||
| MSCI EM |  |
||
| Russell 2000 |  |
||
| Bar US Agg Bnd |  |
||
 |
|||
S&P Sectors |
|
|||||
| Comm. Services |  |
|||||
| Cons. Discretionary |  |
|||||
| Cons. Staples |  |
|||||
| Energy |  |
|||||
| Financials |  |
|||||
| Health Care |  |
|||||
| Industrials |  |
|||||
| Info. Technology |  |
|||||
| Materials |  |
|||||
| Real Estate |  |
|||||
| Utilities |  |
|||||
 |
||||||
| Agent/Broker Dealer Use Only | ||||||
The stellar performance was mimicked at the sector level. Information Technology was the standout sector with an annual return of 56.39 percent. Communication Services was a close second at 54.36 percent. Consumer Discretionary was in third at 41 percent. Aside from these three sectors, which happen to be heavily represented in the Nasdaq composite, the other eight sectors closed mixed with middling performance.
The style boxes saw overall positive performance with the greatest gains in the Large Cap Growth segment with Small Cap Value seeing the lowest return.
The gains last year were not isolated to the equity market. For the various bond indices, most of the Barclays and Bank of America bond indices saw overall positive returns by the end of December. That said, much of those gains came in the final weeks of the year.
For treasuries, the yield curve closed out 2023 not too far off from where it began. After the Fed acknowledged in December that decreases to the Fed Funds rate were beginning to be discussed, this greatly dropped the overall curve which peaked in October.
Market participants will not have to wait long this year as the BLS employment reports will be out Friday with earnings season only a couple weeks away which will lead into the first FOMC Meeting of the year at the end of the month.
New year, new finances?
Check in with your advisor to see if new tax legislation affects you.
| The S&P 500® Index is a capitalization index of 500 stock-designed to measure performance of the broad domestic economy through changes in the aggregate market value of stock representing all major industries. https://us.spindices.com/indices/equity/sp-500 The Dow Jones Industrial Average® (The Dow®), is a price-weighted measure of 30 U.S. blue-chip companies. The index covers all industries except transportation and utilities. https://us.spindices.com/indices/equity/dow-jones-industrial-average The NASDAQ Composite Index measures all NASDAQ domestic and international based common type stocks listed on The NASDAQ Stock Market. Today the NASDAQ Composite includes over 2,500 companies, more than most other stock market indexes. Because it is so broad-based, the Composite is one of the most widely followed and quoted major market indexes. https://indexes.nasdaqomx.com/Index/Overview/COMP The MSCI World Index, which is part of The Modern Index Strategy, is a broad global equity benchmark that represents large and mid-cap equity performance across 23 developed markets countries. It covers approximately 85% of the free float-adjusted market capitalization in each country and MSCI World benchmark does not offer exposure to emerging markets. The MSCI Emerging Markets (EM) Index is designed to represent the performance of large- and mid-cap securities in 24 Emerging Markets countries of the Americas, Europe, the Middle East, Africa and Asia. As of December 2017, it had more than 830 constituents and covered approximately 85% of the free float-adjusted market capitalization in each country. https://www.msci.com/ The S&P GSCI Crude Oil index provides investors with a reliable and publicly available benchmark for investment performance in the crude oil market. https://us.spindices.com/indices Companies in the S&P 500 Sector Indices are classified based on the Global Industry Classification Standard (GICS®). https://us.spindices.com/indices |


