


 Our Leadership Team
 Find An Advisor
 Our Platform
 Advisory
 Alternatives
 Insurance
 Specialized Services
 Individual Investors
 Retirees
 Business Owners
 Family Offices & Institutions
 Doctors
 Tenants
 Accountants
Weekly Market Commentary
Muted Market Moves, Record-Low Volatility, and Strong Earnings
Posted on May 15, 2025
Muted Market Moves, Record-Low Volatility, and Strong Earnings
The Major Markets closed mostly lower last week. Emerging Markets was the lone holdout in positive territory. What was most notable about last week was the fact that it wasn’t all that notable, at least in terms of volatility. For the S&P 500, it marked the lowest weekly change since February, even if it was at a slight loss.
The VIX further highlighted this change in overall market sentiment as the Volatility Index reached its lowest level since the Liberation Day Tariff announcement.
Monday did see the break of the longest daily winning streak in 20 years with the first loss after 9 consecutive days of gains for the S&P 500.
Despite the relative calm within the headline indices, there were still some significant developments last week. Last week held the largest number of individual companies releasing their earnings this quarter. Zachs reported that 1777 companies would be reporting last week.
Fact Set offered up some optimism in the form of an analysis of the 90% of S&P 500 companies that have reported thus far this quarter. Of these companies, 78% reported a beat in their EPS estimates. This exceeds both the 10 and 5-year averages.
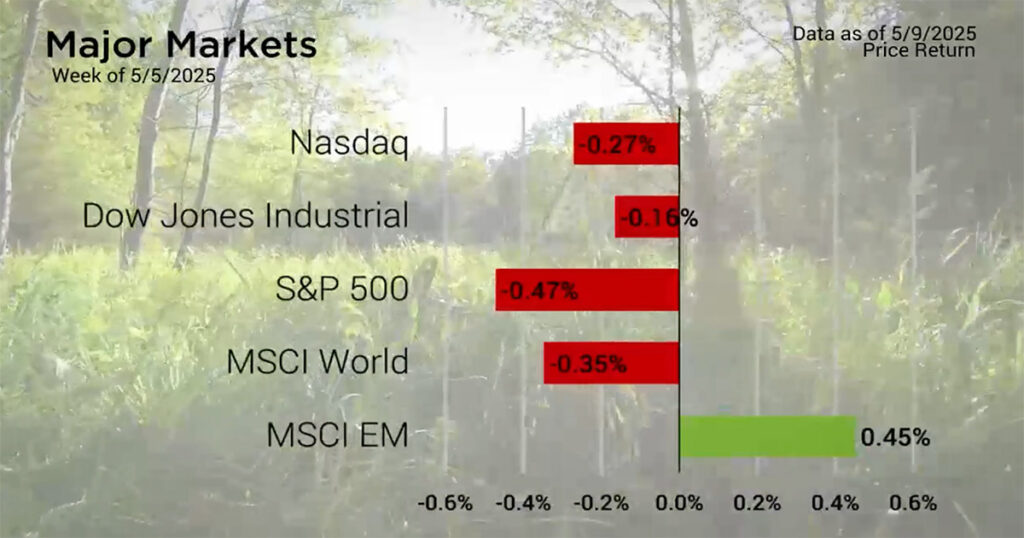
Major Markets |
YTD as of 05/09/2025 | ||
| Nasdaq |  |
||
| Dow Jones Industrial |  |
||
| S&P 500 |  |
||
| MSCI World |  |
||
| MSCI EM |  |
||
| Russell 2000 |  |
||
| Bar US Agg Bnd |  |
||
 |
|||
S&P Sectors |
|
|||||
| Comm. Services |  |
|||||
| Cons. Discretionary |  |
|||||
| Cons. Staples |  |
|||||
| Energy |  |
|||||
| Financials |  |
|||||
| Health Care |  |
|||||
| Industrials |  |
|||||
| Info. Technology |  |
|||||
| Materials |  |
|||||
| Real Estate |  |
|||||
| Utilities |  |
|||||
 |
||||||
| Agent/Broker Dealer Use Only | ||||||
Midweek, the FOMC held their May Committee Meeting which was much in line with expectations. The Fed Funds Rate remained unchanged and little concern seemed to be given around the recent negative GDP print.
Looking ahead, the CME Group’s Fed Watch tool has seen elevated interest rates stretch further in the future. While market participants had long expected that rates would hold steady at the May meeting, the June and July meetings have shifted to see the current interest rate level likely hold out through the summer months.
High earner? Learn how a backdoor Roth IRA can help maximize your retirement savings—even if you face income limits.
| The S&P 500® Index is a capitalization index of 500 stock-designed to measure performance of the broad domestic economy through changes in the aggregate market value of stock representing all major industries. https://us.spindices.com/indices/equity/sp-500 The Dow Jones Industrial Average® (The Dow®), is a price-weighted measure of 30 U.S. blue-chip companies. The index covers all industries except transportation and utilities. https://us.spindices.com/indices/equity/dow-jones-industrial-average The NASDAQ Composite Index measures all NASDAQ domestic and international based common type stocks listed on The NASDAQ Stock Market. Today the NASDAQ Composite includes over 2,500 companies, more than most other stock market indexes. Because it is so broad-based, the Composite is one of the most widely followed and quoted major market indexes. https://indexes.nasdaqomx.com/Index/Overview/COMP The MSCI World Index, which is part of The Modern Index Strategy, is a broad global equity benchmark that represents large and mid-cap equity performance across 23 developed markets countries. It covers approximately 85% of the free float-adjusted market capitalization in each country and MSCI World benchmark does not offer exposure to emerging markets. The MSCI Emerging Markets (EM) Index is designed to represent the performance of large- and mid-cap securities in 24 Emerging Markets countries of the Americas, Europe, the Middle East, Africa and Asia. As of December 2017, it had more than 830 constituents and covered approximately 85% of the free float-adjusted market capitalization in each country. https://www.msci.com/ The S&P GSCI Crude Oil index provides investors with a reliable and publicly available benchmark for investment performance in the crude oil market. https://us.spindices.com/indices Companies in the S&P 500 Sector Indices are classified based on the Global Industry Classification Standard (GICS®). https://us.spindices.com/indices |


