


 Our Leadership Team
 Find An Advisor
 Our Platform
 Advisory
 Alternatives
 Insurance
 Specialized Services
 Individual Investors
 Retirees
 Business Owners
 Family Offices & Institutions
 Doctors
 Tenants
 Accountants
 RIA / Advisor Firms
Weekly Market Commentary
Markets Surge to New Highs Amid Mixed Economic Signals
Posted on May 23, 2024
The Major Markets extended their gains last week with positive performance in all five indices. For the S&P 500, this marked the fourth consecutive week of gains, surpassing the number of weeks of losses that preceded it and had the added benefit of seeing a new all-time closing high on Wednesday.
With the markets now trading on the other side of the bell curve for the number of companies reporting earnings, the focus shifted back towards the economic calendar. Tuesday had the release of the Producer Price Index which came in hotter than expected, especially within the services segments. This elevated number was a blow to those who were hoping to see some progress at curtailing inflation and consequently a more favorable interest rate environment.
That news did come on Wednesday when the Consumer Price Index saw a headline below estimates for April’s monthly increase. This was welcome news on the heels of the PPI result and helped to boost Wednesday’s gains. This was enough to mark a new all-time closing high for the S&P 500 and stood as the largest daily gains for last week.
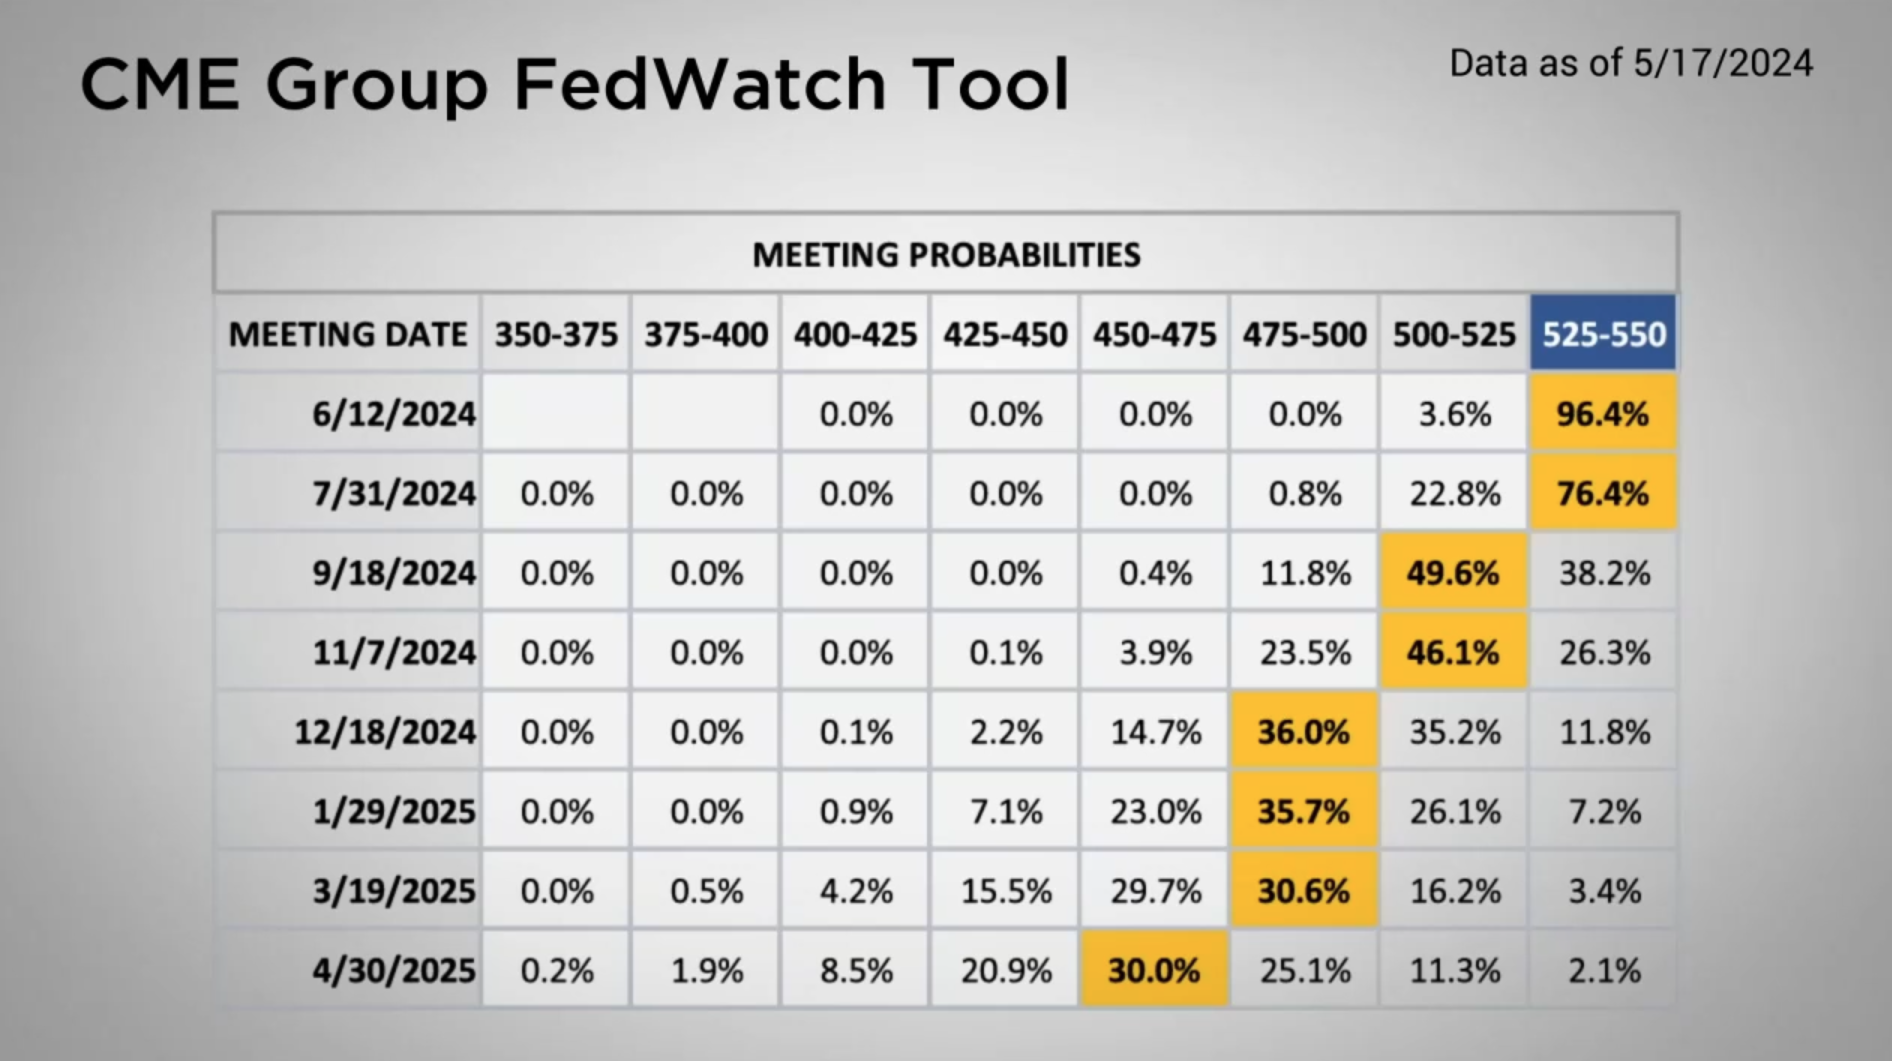
Furthermore, this helped to firm up expectations of two rate cuts for this year, according to the CME Group’s Fed Watch Tool. While the adjustments in probabilities at the end of the week wasn’t too significant, there was an increase in the odds of a 25-basis point cut at the September FOMC Meeting and another one in December. However, the expectations of the Fed Funds rate sitting between the 475 -500 is only slightly more favorable than the combination of no or one 25-basis point decrease in the Fed Funds Rate.
Major Markets |
YTD as of 5/17/2024 | ||
| Nasdaq |  |
||
| Dow Jones Industrial |  |
||
| S&P 500 |  |
||
| MSCI World |  |
||
| MSCI EM |  |
||
| Russell 2000 |  |
||
| Bar US Agg Bnd |  |
||
 |
|||
S&P Sectors |
|
|||||
| Comm. Services |  |
|||||
| Cons. Discretionary |  |
|||||
| Cons. Staples |  |
|||||
| Energy |  |
|||||
| Financials |  |
|||||
| Health Care |  |
|||||
| Industrials |  |
|||||
| Info. Technology |  |
|||||
| Materials |  |
|||||
| Real Estate |  |
|||||
| Utilities |  |
|||||
 |
||||||
| Agent/Broker Dealer Use Only | ||||||
Nevertheless, this stimulated the bond markets as the Treasury curve saw yields drop by as much as 28 basis points in the intermediate term of the yield curve.
This in turn gave the bond markets a welcome pop for the week, recovering some of the earlier year-to-date losses.
Concerned about inflation? Check out our Tips to Reduce Risks In Case of Recession.
| The S&P 500® Index is a capitalization index of 500 stock-designed to measure performance of the broad domestic economy through changes in the aggregate market value of stock representing all major industries. https://us.spindices.com/indices/equity/sp-500 The Dow Jones Industrial Average® (The Dow®), is a price-weighted measure of 30 U.S. blue-chip companies. The index covers all industries except transportation and utilities. https://us.spindices.com/indices/equity/dow-jones-industrial-average The NASDAQ Composite Index measures all NASDAQ domestic and international based common type stocks listed on The NASDAQ Stock Market. Today the NASDAQ Composite includes over 2,500 companies, more than most other stock market indexes. Because it is so broad-based, the Composite is one of the most widely followed and quoted major market indexes. https://indexes.nasdaqomx.com/Index/Overview/COMP The MSCI World Index, which is part of The Modern Index Strategy, is a broad global equity benchmark that represents large and mid-cap equity performance across 23 developed markets countries. It covers approximately 85% of the free float-adjusted market capitalization in each country and MSCI World benchmark does not offer exposure to emerging markets. The MSCI Emerging Markets (EM) Index is designed to represent the performance of large- and mid-cap securities in 24 Emerging Markets countries of the Americas, Europe, the Middle East, Africa and Asia. As of December 2017, it had more than 830 constituents and covered approximately 85% of the free float-adjusted market capitalization in each country. https://www.msci.com/ The S&P GSCI Crude Oil index provides investors with a reliable and publicly available benchmark for investment performance in the crude oil market. https://us.spindices.com/indices Companies in the S&P 500 Sector Indices are classified based on the Global Industry Classification Standard (GICS®). https://us.spindices.com/indices |


