Weekly Market Commentary
Major Markets Closed Higher Again Last Week
Posted on October 1, 2024
Major Markets Closed Higher Again Last Week
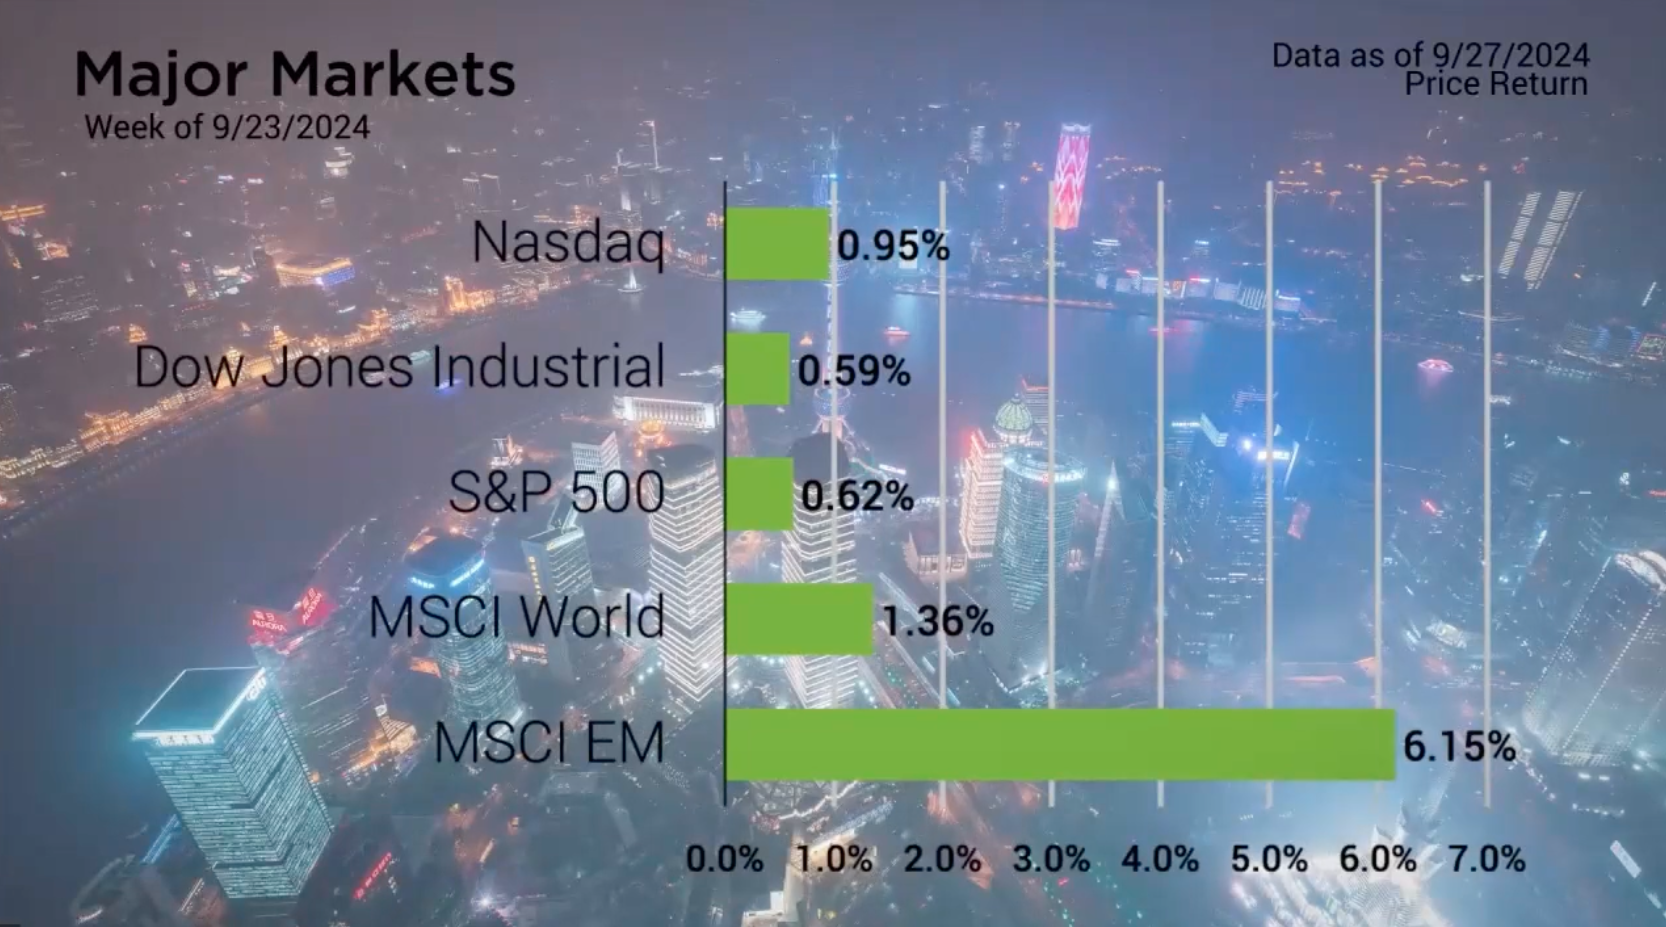
The Major Markets closed higher again last week. The standout performer was the MSCI Emerging Market Index with its 6.15% weekly gain, which effectively sextupled each of the other four indices.
The gains in Emerging Markets were largely attributed to news out of China. China represents about a quarter of the overall weighting of this particular index, followed by India, Taiwan, and other countries. However, last week China announced a series of steps to stimulate their economy. This included a cut to their interest rate, stimulus to their banking system, and a number of other announced and rumored programs to get back to their 5% growth target. The country has been experiencing a deflationary period for some time due to overall consumer weakness and a struggling real estate market.
This news was significant as China as a whole represents the second-largest economy. This stimulus could have knock-on effects to global commodity prices like Crude Oil which has been trading back down toward a multi-year low since the last significant spike back in 2022.
Back stateside, some of the economic themes seen in China echoed in the domestic market. Consumer Confidence fell in September to 98.7 compared to the growth expected. This pulls the index back down towards the bottom of the range that has developed post Covid.

Major Markets |
YTD as of 09/27/2024 | ||
| Nasdaq |  |
||
| Dow Jones Industrial |  |
||
| S&P 500 |  |
||
| MSCI World |  |
||
| MSCI EM |  |
||
| Russell 2000 |  |
||
| Bar US Agg Bnd |  |
||
 |
|||
S&P Sectors |
|
|||||
| Comm. Services |  |
|||||
| Cons. Discretionary |  |
|||||
| Cons. Staples |  |
|||||
| Energy |  |
|||||
| Financials |  |
|||||
| Health Care |  |
|||||
| Industrials |  |
|||||
| Info. Technology |  |
|||||
| Materials |  |
|||||
| Real Estate |  |
|||||
| Utilities |  |
|||||
 |
||||||
| Agent/Broker Dealer Use Only | ||||||
The Case-Shiller home price index was short of year-over-year growth expectations but set another monthly all-time high. To have the Fed cut interest rates at a time when residential home prices are at an all-time high was an interesting juxtaposition for some market analysts. However, a significant concern has been in the commercial real estate market which has actually seen declines in recent years on average.
Finally, Personal Consumption Expenditures was lower than expected year-over year, leading to greater expectations of another 50-basis point rate cut in November. As it stands at Friday’s close, the CME Group FedWatch tool shows the greatest likelihood of the Fed Funds rate settling at the 4% to 4.25% level at the end of the year.
https://www.conference-board.org/topics/consumer-confidence
Concerned about inflation? Check out our Tips to Reduce Risks In Case of Recession.
| The S&P 500® Index is a capitalization index of 500 stock-designed to measure performance of the broad domestic economy through changes in the aggregate market value of stock representing all major industries. https://us.spindices.com/indices/equity/sp-500 The Dow Jones Industrial Average® (The Dow®), is a price-weighted measure of 30 U.S. blue-chip companies. The index covers all industries except transportation and utilities. https://us.spindices.com/indices/equity/dow-jones-industrial-average The NASDAQ Composite Index measures all NASDAQ domestic and international based common type stocks listed on The NASDAQ Stock Market. Today the NASDAQ Composite includes over 2,500 companies, more than most other stock market indexes. Because it is so broad-based, the Composite is one of the most widely followed and quoted major market indexes. https://indexes.nasdaqomx.com/Index/Overview/COMP The MSCI World Index, which is part of The Modern Index Strategy, is a broad global equity benchmark that represents large and mid-cap equity performance across 23 developed markets countries. It covers approximately 85% of the free float-adjusted market capitalization in each country and MSCI World benchmark does not offer exposure to emerging markets. The MSCI Emerging Markets (EM) Index is designed to represent the performance of large- and mid-cap securities in 24 Emerging Markets countries of the Americas, Europe, the Middle East, Africa and Asia. As of December 2017, it had more than 830 constituents and covered approximately 85% of the free float-adjusted market capitalization in each country. https://www.msci.com/ The S&P GSCI Crude Oil index provides investors with a reliable and publicly available benchmark for investment performance in the crude oil market. https://us.spindices.com/indices Companies in the S&P 500 Sector Indices are classified based on the Global Industry Classification Standard (GICS®). https://us.spindices.com/indices |


