


 Our Leadership Team
 Find An Advisor
 Our Platform
 Advisory
 Alternatives
 Insurance
 Specialized Services
 Individual Investors
 Retirees
 Business Owners
 Family Offices & Institutions
 Doctors
 Tenants
 Accountants
 RIA / Advisor Firms
Weekly Market Commentary
Major Indices Rebound, Tech Leads the Way
Posted on May 2, 2024
The Major Markets recovered last week as all five indices managed to close higher. For the domestic Markets, this stood as the first positive weekly return for the 2nd quarter, breaking a three-week losing streak.
The gains were widespread as all 12 sectors climbed higher. That said Information Technology was the clear winner for the week as it added over 5 percentage points.
Last week served as the first significant week of earnings results as over 800 companies reported earnings. Some of these companies were in the IT and communication sectors and fueled additional excitement about the use of AI as they reported earnings. This week, another 1200 companies will be reporting Q1 earnings results with the weekly peak of results next week.
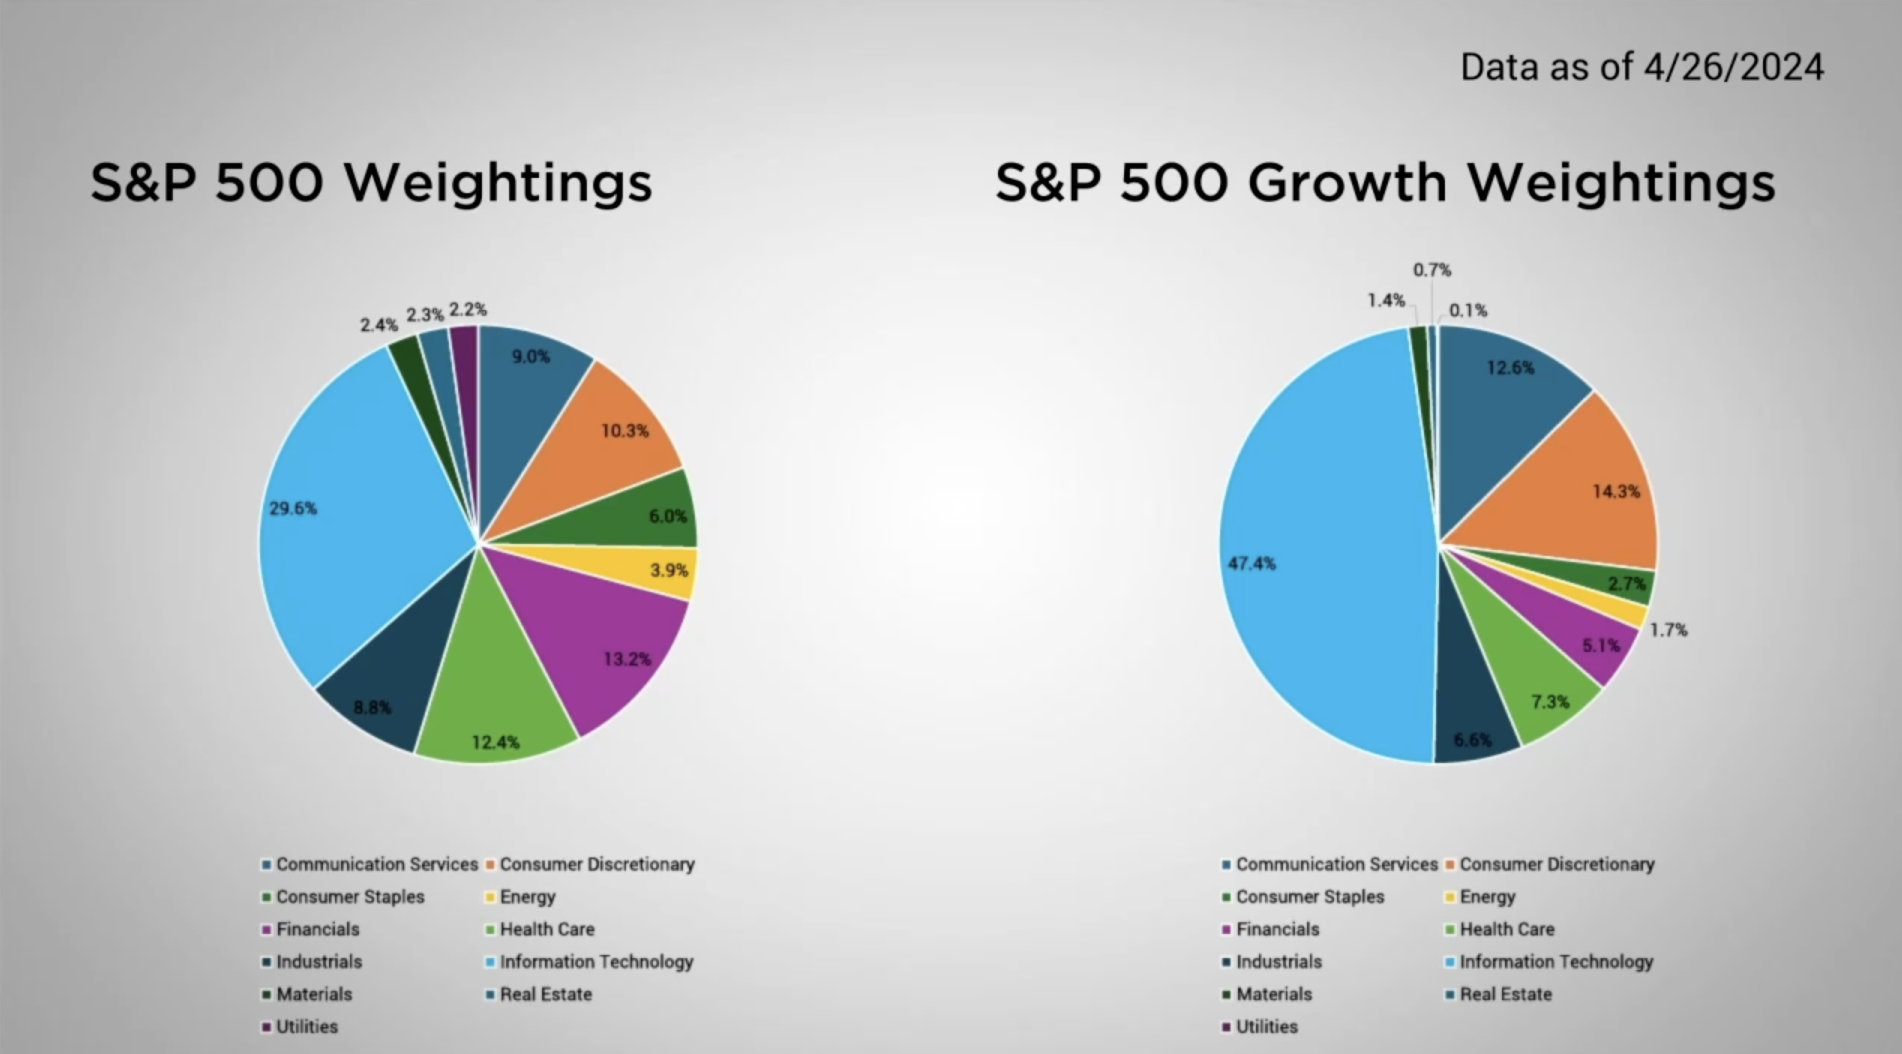
Breaking the domestic market down by style box, the greatest gains were in the large gap growth segment. The S&P 500 Growth index, which is a large cap growth index, has a significant weighting in Information Technology as the sector represents nearly half of the overall index. Meanwhile, the S&P 500, which can be viewed as a blended large cap index, only has a 30% exposure to that sector. As a result, the growth side of the large cap style box is much more likely to be swayed by over or underperformance in the tech centric sectors.
Major Markets |
YTD as of 04/19/2024 | ||
| Nasdaq |  |
||
| Dow Jones Industrial |  |
||
| S&P 500 |  |
||
| MSCI World |  |
||
| MSCI EM |  |
||
| Russell 2000 |  |
||
| Bar US Agg Bnd |  |
||
 |
|||
S&P Sectors |
|
|||||
| Comm. Services |  |
|||||
| Cons. Discretionary |  |
|||||
| Cons. Staples |  |
|||||
| Energy |  |
|||||
| Financials |  |
|||||
| Health Care |  |
|||||
| Industrials |  |
|||||
| Info. Technology |  |
|||||
| Materials |  |
|||||
| Real Estate |  |
|||||
| Utilities |  |
|||||
 |
||||||
| Agent/Broker Dealer Use Only | ||||||
Last Week’s Economic Calendar saw the release of the first quarter GDP. The headline result of 1.6% was well below the expectations of 2.4% to 2.2%. This served as the lowest reading since the first and second quarters of 2022 that escaped being labeled as a recession.
The Personal Consumption Expenditures came in hotter with an annualized reading of 3.4%. This is viewed as an important component of measuring inflation and was significantly higher than the 1.8% result from Q4 of 2023. The domestic markets managed to absorb this news and still close the week higher although Wednesday’s and Thursday’s performance was subsequently bearish.
This inflation reading did little to impact the overall Treasury yield curve. However, the likelihood of the first rate cut of this year saw the odds push further out to September. Even still, the meetings from September onward through the rest of the year have probabilities as high as 40% and as low as 19% that the current Fed Funds target range will remain in the second half of the year.
Concerned about inflation? Check out our Tips to Reduce Risks In Case of Recession.
| The S&P 500® Index is a capitalization index of 500 stock-designed to measure performance of the broad domestic economy through changes in the aggregate market value of stock representing all major industries. https://us.spindices.com/indices/equity/sp-500 The Dow Jones Industrial Average® (The Dow®), is a price-weighted measure of 30 U.S. blue-chip companies. The index covers all industries except transportation and utilities. https://us.spindices.com/indices/equity/dow-jones-industrial-average The NASDAQ Composite Index measures all NASDAQ domestic and international based common type stocks listed on The NASDAQ Stock Market. Today the NASDAQ Composite includes over 2,500 companies, more than most other stock market indexes. Because it is so broad-based, the Composite is one of the most widely followed and quoted major market indexes. https://indexes.nasdaqomx.com/Index/Overview/COMP The MSCI World Index, which is part of The Modern Index Strategy, is a broad global equity benchmark that represents large and mid-cap equity performance across 23 developed markets countries. It covers approximately 85% of the free float-adjusted market capitalization in each country and MSCI World benchmark does not offer exposure to emerging markets. The MSCI Emerging Markets (EM) Index is designed to represent the performance of large- and mid-cap securities in 24 Emerging Markets countries of the Americas, Europe, the Middle East, Africa and Asia. As of December 2017, it had more than 830 constituents and covered approximately 85% of the free float-adjusted market capitalization in each country. https://www.msci.com/ The S&P GSCI Crude Oil index provides investors with a reliable and publicly available benchmark for investment performance in the crude oil market. https://us.spindices.com/indices Companies in the S&P 500 Sector Indices are classified based on the Global Industry Classification Standard (GICS®). https://us.spindices.com/indices |


