


 Our Leadership Team
 Find An Advisor
 Our Platform
 Advisory
 Alternatives
 Insurance
 Specialized Services
 Individual Investors
 Retirees
 Business Owners
 Family Offices & Institutions
 Doctors
 Tenants
 Accountants
Weekly Market Commentary
July CPI Results Came in as Expected
Posted on August 14, 2023
Market Commentary by Mitchell Wood, Larson COO
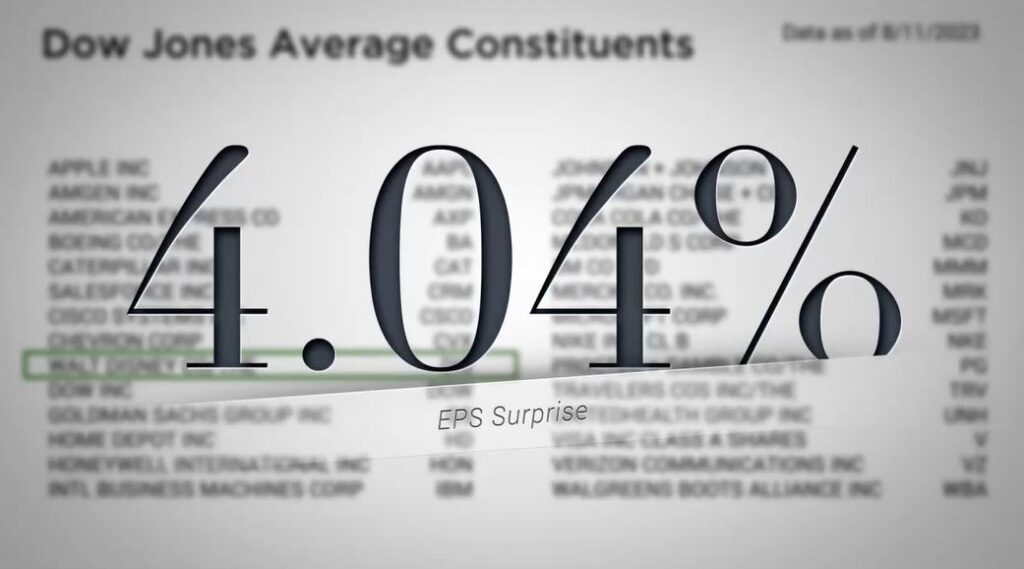
| The first full trading week of August saw mixed results as the Nasdaq and Emerging Markets vied for last place among these five indices. The Dow Jones, however, managed to close higher as the narrow list of components worked to its advantage last week. The gains in the Dow were fueled at least in part by the beat that Disney had with a roughly four percent surprise compared to the earnings per share estimate. The earnings calendar reached its zenith the week prior, but last week’s 1,485 companies reporting was not insignificant. There are still over a thousand companies’ earnings releases yet over the next few weeks. That said, the bulk of the S&P 500 companies have now reported. |
| At the sector level, the segments that make up the Nasdaq were clearly the most impacted last week, while the more diverse, although smaller, segments of the S&P 500 closed mostly higher. In economic news, the July CPI results came in at expectation with an increase of 0.2 percent for the month while the year-over-year number for the headline result was slightly favorable with a 3.2 percent result compared to the 3.3 percent expected. |
For treasuries, the intermediate to longer-term end of yield-curve began to climb higher.
| The greatest increase was in the 5 and 7-year durations as they added 16 basis points to the yield. This pulled the overall bond market down. The Bloomberg Barclays aggregate bond index fell 64 basis points to close the week with a reduced year-to-date gain, also of 64 basis-points. |
Have a question for your advisor?
Click “Schedule a Consult” and get in touch today.
| The S&P 500® Index is a capitalization index of 500 stock-designed to measure performance of the broad domestic economy through changes in the aggregate market value of stock representing all major industries. https://us.spindices.com/indices/equity/sp-500 The Dow Jones Industrial Average® (The Dow®), is a price-weighted measure of 30 U.S. blue-chip companies. The index covers all industries except transportation and utilities. https://us.spindices.com/indices/equity/dow-jones-industrial-average The NASDAQ Composite Index measures all NASDAQ domestic and international based common type stocks listed on The NASDAQ Stock Market. Today the NASDAQ Composite includes over 2,500 companies, more than most other stock market indexes. Because it is so broad-based, the Composite is one of the most widely followed and quoted major market indexes. https://indexes.nasdaqomx.com/Index/Overview/COMP The MSCI World Index, which is part of The Modern Index Strategy, is a broad global equity benchmark that represents large and mid-cap equity performance across 23 developed markets countries. It covers approximately 85% of the free float-adjusted market capitalization in each country and MSCI World benchmark does not offer exposure to emerging markets. The MSCI Emerging Markets (EM) Index is designed to represent the performance of large- and mid-cap securities in 24 Emerging Markets countries of the Americas, Europe, the Middle East, Africa and Asia. As of December 2017, it had more than 830 constituents and covered approximately 85% of the free float-adjusted market capitalization in each country. https://www.msci.com/ The S&P GSCI Crude Oil index provides investors with a reliable and publicly available benchmark for investment performance in the crude oil market. https://us.spindices.com/indices Companies in the S&P 500 Sector Indices are classified based on the Global Industry Classification Standard (GICS®). https://us.spindices.com/indices |


