


 Our Leadership Team
 Find An Advisor
 Our Platform
 Advisory
 Alternatives
 Insurance
 Specialized Services
 Individual Investors
 Retirees
 Business Owners
 Family Offices & Institutions
 Doctors
 Tenants
 Accountants
 RIA / Advisor Firms
Weekly Market Commentary
Global Markets Rebound Despite Mixed Economic Signals
Posted on May 8, 2024
The major markets continued their gains after April’s initial weakness. All five indices climbed higher with Emerging Markets remarkably leading the pack. The Emerging Market Index was fueled by strength in China as the MSCI China index added over four percentage points last week. The Hang Seng Index, a major Chinese benchmark, managed to be one of the top performing global indices for April.
But for the domestic market, the half a percent gain in the S&P 500 was yet another positive weekly return after April’s rough Q2 open. Nevertheless, the result was that April saw the first monthly loss since October of last year.
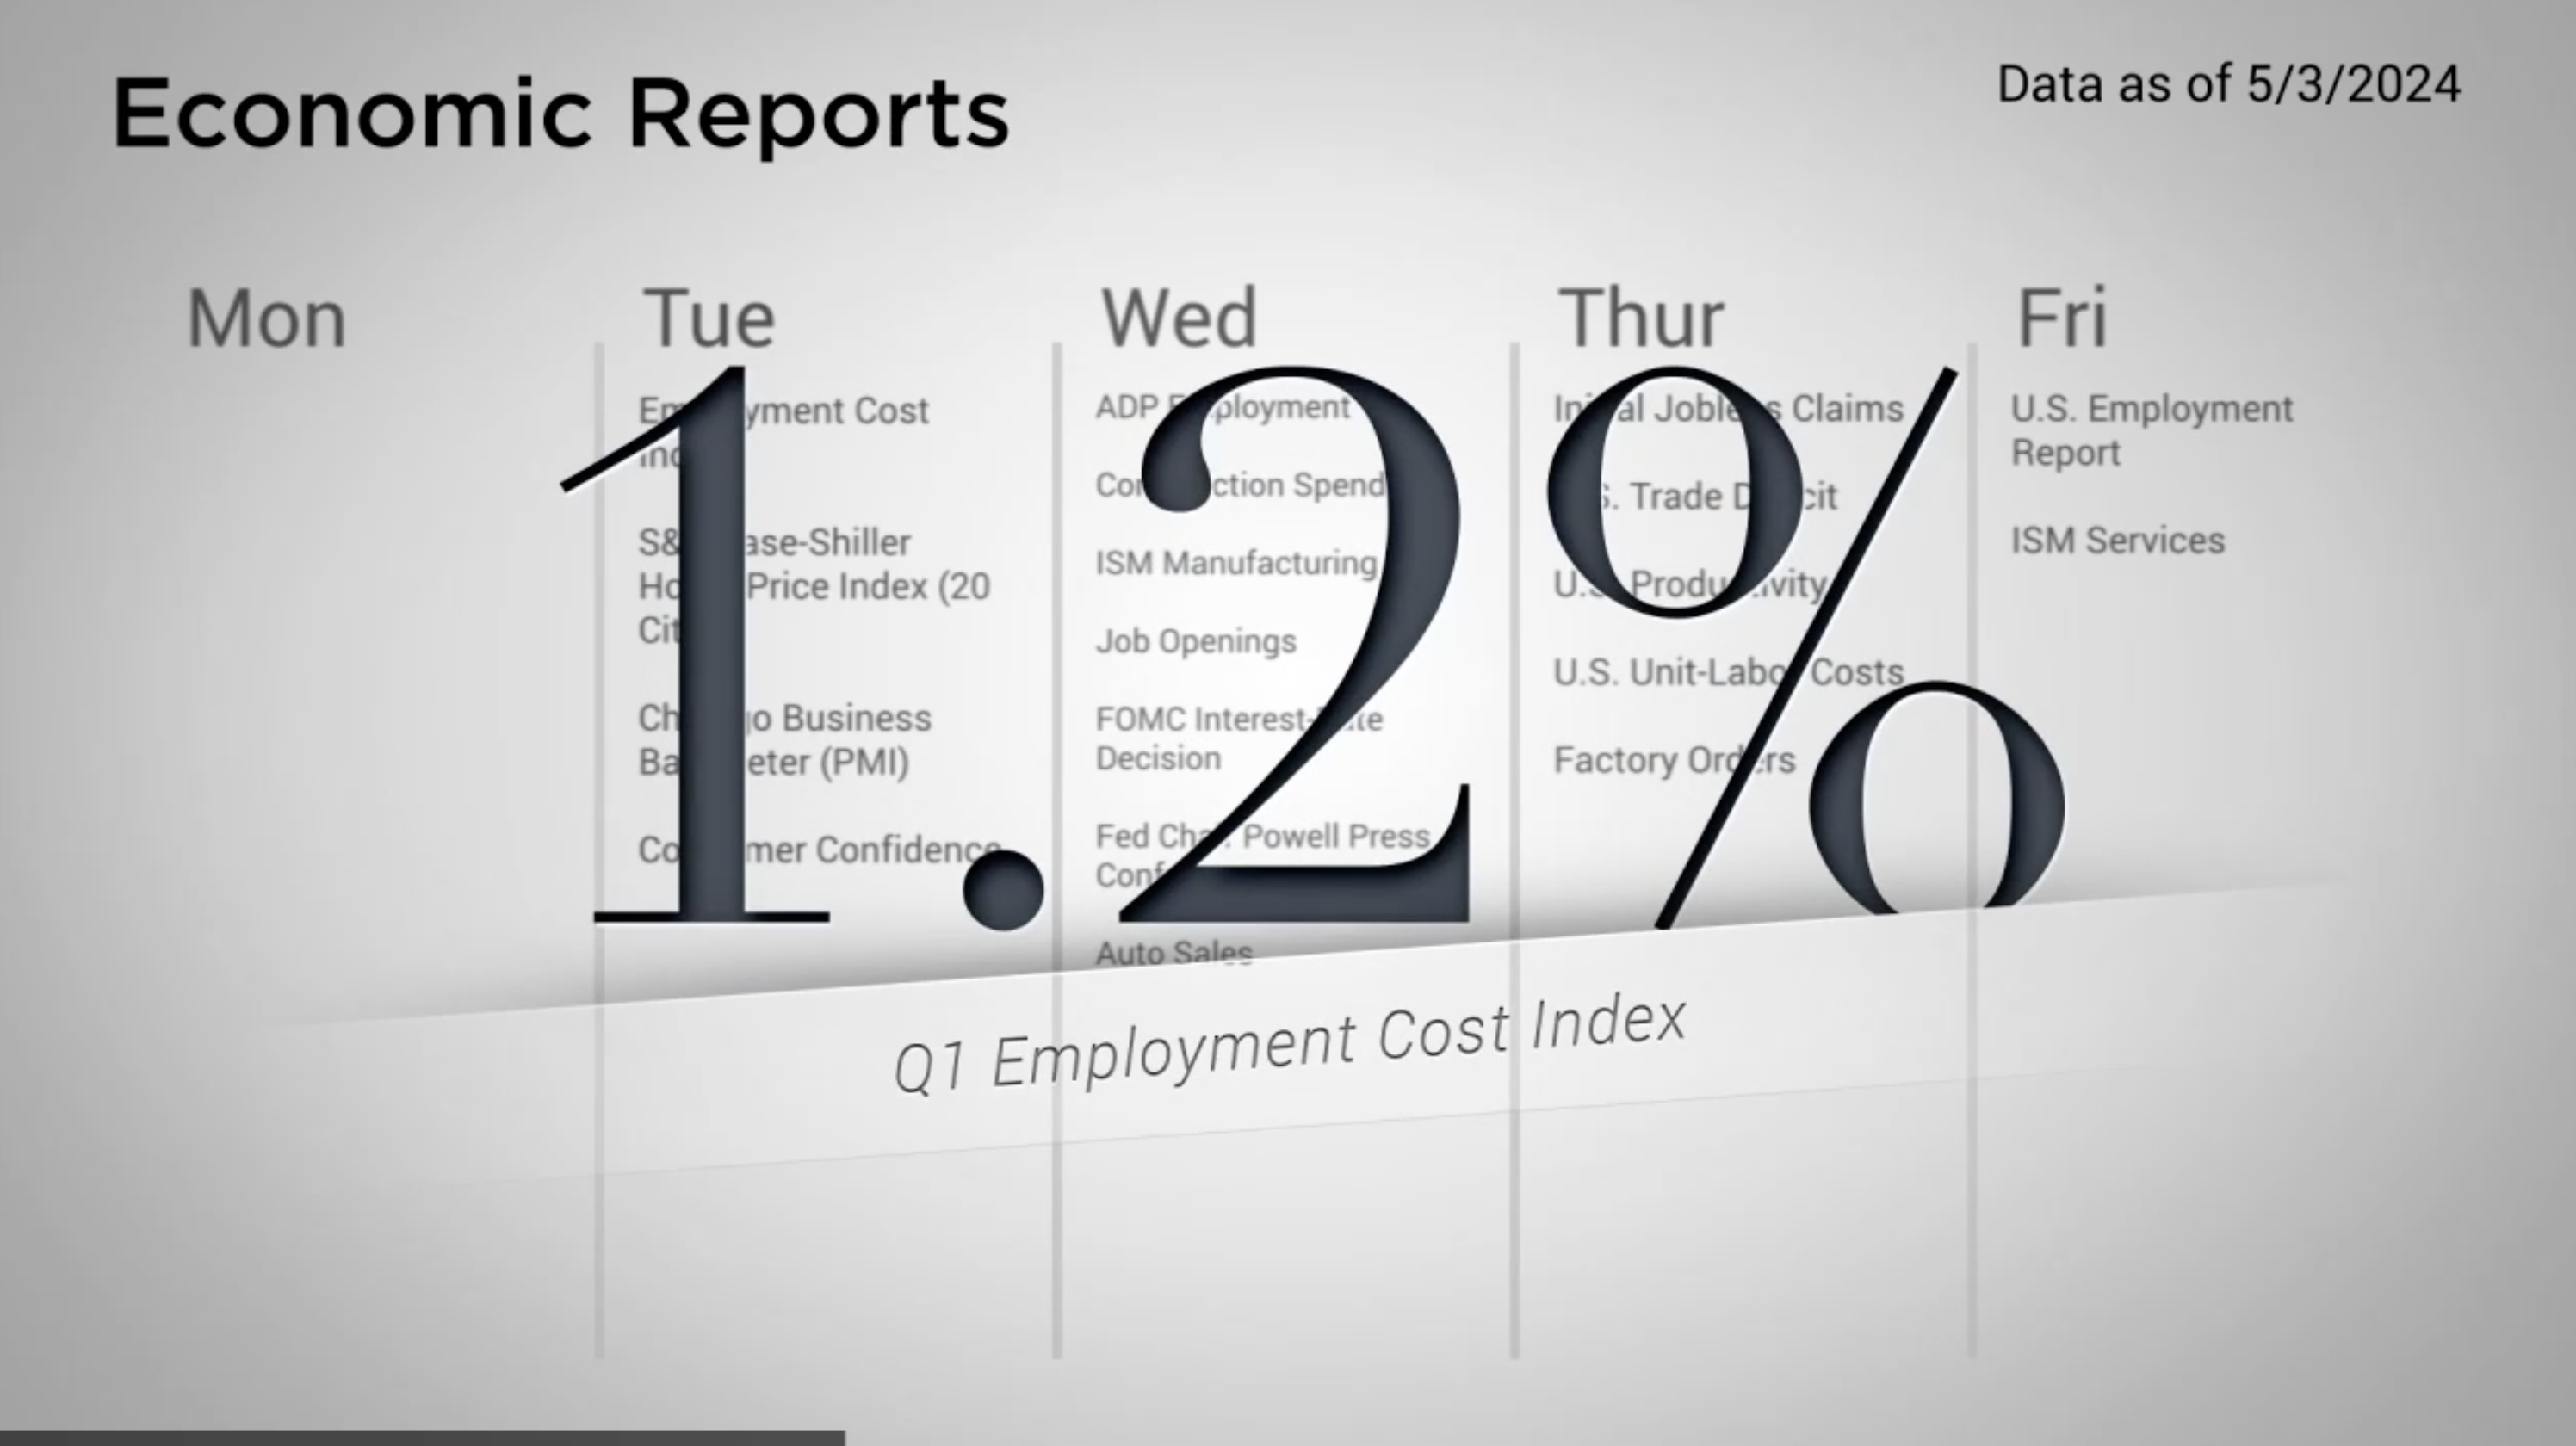
Last week was marked with a number of economic releases that pointed to a mixed economic picture. The Employment Cost Index released Tuesday saw increased compensation costs for the first quarter, exceeding estimates as well as the prior quarter’s result. Consumer Confidence also dropped in April as consumers worried about the prices of food and gas . This inflationary pressure weighed on the markets as it experienced the largest daily pullback since January on Tuesday.
Midweek, FOMC met for the third time this year and did nothing to the Fed Funds rate. Fed Chairman Jerome Powell wasn’t offered much to soothe inflation angst aside from saying:
“Today, the FOMC decided to leave our policy interest rate unchanged and to continue to reduce our securities holdings, though at a slower pace. Our restrictive stance of monetary policy has been putting downward pressure on economic activity and inflation, and the risks to achieving our employment and inflation goals have moved toward better balance over the past year. However, in recent months inflation has shown a lack of further progress toward our 2 percent objective, and we remain highly attentive to inflation risks “
Major Markets |
YTD as of 04/26/2024 | ||
| Nasdaq |  |
||
| Dow Jones Industrial |  |
||
| S&P 500 |  |
||
| MSCI World |  |
||
| MSCI EM |  |
||
| Russell 2000 |  |
||
| Bar US Agg Bnd |  |
||
 |
|||
S&P Sectors |
|
|||||
| Comm. Services |  |
|||||
| Cons. Discretionary |  |
|||||
| Cons. Staples |  |
|||||
| Energy |  |
|||||
| Financials |  |
|||||
| Health Care |  |
|||||
| Industrials |  |
|||||
| Info. Technology |  |
|||||
| Materials |  |
|||||
| Real Estate |  |
|||||
| Utilities |  |
|||||
 |
||||||
| Agent/Broker Dealer Use Only | ||||||
Later in the press conference, Powell stated in the Question-and-Answer section that “…it’s unlikely that the next policy rate move will be a hike…”
The remainder of the week saw the market recover. Friday held the release of April’s BLS Employment Report which came in below expectations. The headline reading of 175,000 new jobs was low enough, yet still positive, to give investors hope that inflation wasn’t fully ramping up again.
https://www.reuters.com/markets/us/us-consumer-confidence-deteriorates-april-2024-04-30/
https://www.federalreserve.gov/mediacenter/files/FOMCpresconf20240501.pdf
Concerned about inflation? Check out our Tips to Reduce Risks In Case of Recession.
| The S&P 500® Index is a capitalization index of 500 stock-designed to measure performance of the broad domestic economy through changes in the aggregate market value of stock representing all major industries. https://us.spindices.com/indices/equity/sp-500 The Dow Jones Industrial Average® (The Dow®), is a price-weighted measure of 30 U.S. blue-chip companies. The index covers all industries except transportation and utilities. https://us.spindices.com/indices/equity/dow-jones-industrial-average The NASDAQ Composite Index measures all NASDAQ domestic and international based common type stocks listed on The NASDAQ Stock Market. Today the NASDAQ Composite includes over 2,500 companies, more than most other stock market indexes. Because it is so broad-based, the Composite is one of the most widely followed and quoted major market indexes. https://indexes.nasdaqomx.com/Index/Overview/COMP The MSCI World Index, which is part of The Modern Index Strategy, is a broad global equity benchmark that represents large and mid-cap equity performance across 23 developed markets countries. It covers approximately 85% of the free float-adjusted market capitalization in each country and MSCI World benchmark does not offer exposure to emerging markets. The MSCI Emerging Markets (EM) Index is designed to represent the performance of large- and mid-cap securities in 24 Emerging Markets countries of the Americas, Europe, the Middle East, Africa and Asia. As of December 2017, it had more than 830 constituents and covered approximately 85% of the free float-adjusted market capitalization in each country. https://www.msci.com/ The S&P GSCI Crude Oil index provides investors with a reliable and publicly available benchmark for investment performance in the crude oil market. https://us.spindices.com/indices Companies in the S&P 500 Sector Indices are classified based on the Global Industry Classification Standard (GICS®). https://us.spindices.com/indices |


