


 Our Leadership Team
 Find An Advisor
 Our Platform
 Advisory
 Alternatives
 Insurance
 Specialized Services
 Individual Investors
 Retirees
 Business Owners
 Family Offices & Institutions
 Doctors
 Tenants
 Accountants
 RIA / Advisor Firms
Weekly Market Commentary
Gains in All Five Indices
Posted on June 7, 2023
Market Commentary by Mitchell Wood, Larson COO
| The Major Markets closed the month of May with gains as investors appeared to embrace some market optimism during the holiday shortened trading week. The gains in all five indices exceeded a percentage point with the Dow Jones and the Nasdaq vying for the top position with just over two percentage point gains. For the S&P 500, the blue-chip index flirted with the 4,300 level after breaching 4,200 for the first time this year just two weeks prior. These gains took the index into double digit territory at Friday’s close. The gains were even more significant in the Small-Cap segments of the style box. The gain of 3.43 percent within the Small Cap Value box shadowed the broader S&P 500 return for the week. That said, the gains simply returned the year-to-date Small Cap Value style box to positive territory last week. |
This disparity is particularly noteworthy given how the first quarter of the year began.
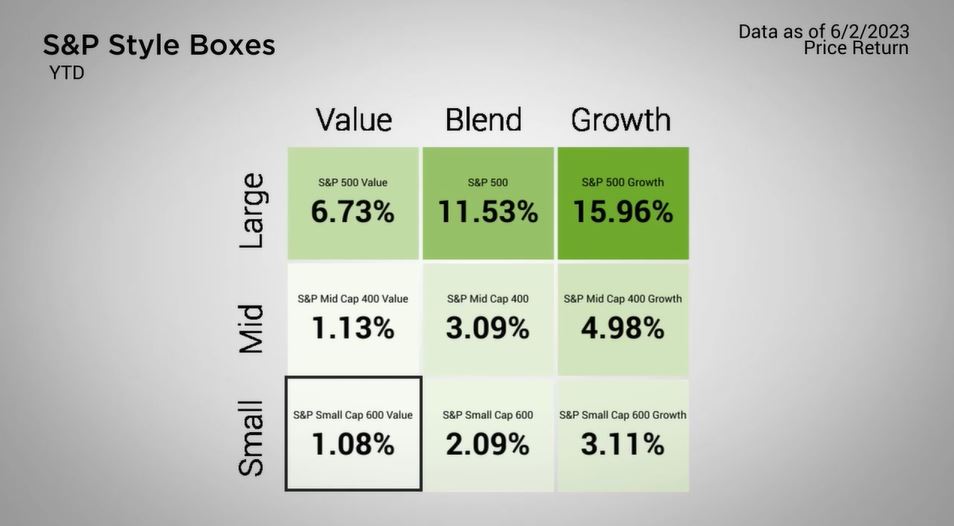
| For the last year, the performance of the S&P 600 Value index and the S&P 500 has been remarkably similar, up until the middle of March. The Small Cap 600 Value Index traded to an intra-year peak which exceeded 15 percent at the beginning of February before the sell-off into the end of the quarter. However, as the S&P 500 recovered mid-March, small cap floundered into new year-to-date lows. This disparity is especially notable given that as of Friday the total market cap of Apple, the largest single member of the S&P 500, eclipsed the total market cap of the Russell 2000, another index which measures the small cap segment of the domestic market. Some analysts have attributed this broad return to Large Cap, and Technology in particular, due to the sudden popularity of AI tools and anticipation of Fed accommodation. Furthermore, the general sentiment of market participants has been that the Federal Reserve will pivot from the raising of interest rates. As of Friday, the CME Group still places the greater probability of interest rates holding steady at the 500-525 basis point range for next week’s June meeting. That said, there’s still a greater than not probability of an additional 25 basis point or more increase at the July and September meetings. https://finance.yahoo.com/news/the-magnificent-seven-tech-stocks-drive-markets-higher-as-ai-mania-grips-investors-123029634.html |
Are you on track to reach your financial goals?
Click “Schedule a Consult” to set up an appointment with your advisor.
| The S&P 500® Index is a capitalization index of 500 stock-designed to measure performance of the broad domestic economy through changes in the aggregate market value of stock representing all major industries. https://us.spindices.com/indices/equity/sp-500 The Dow Jones Industrial Average® (The Dow®), is a price-weighted measure of 30 U.S. blue-chip companies. The index covers all industries except transportation and utilities. https://us.spindices.com/indices/equity/dow-jones-industrial-average The NASDAQ Composite Index measures all NASDAQ domestic and international based common type stocks listed on The NASDAQ Stock Market. Today the NASDAQ Composite includes over 2,500 companies, more than most other stock market indexes. Because it is so broad-based, the Composite is one of the most widely followed and quoted major market indexes. https://indexes.nasdaqomx.com/Index/Overview/COMP The MSCI World Index, which is part of The Modern Index Strategy, is a broad global equity benchmark that represents large and mid-cap equity performance across 23 developed markets countries. It covers approximately 85% of the free float-adjusted market capitalization in each country and MSCI World benchmark does not offer exposure to emerging markets. The MSCI Emerging Markets (EM) Index is designed to represent the performance of large- and mid-cap securities in 24 Emerging Markets countries of the Americas, Europe, the Middle East, Africa and Asia. As of December 2017, it had more than 830 constituents and covered approximately 85% of the free float-adjusted market capitalization in each country. https://www.msci.com/ The S&P GSCI Crude Oil index provides investors with a reliable and publicly available benchmark for investment performance in the crude oil market. https://us.spindices.com/indices Companies in the S&P 500 Sector Indices are classified based on the Global Industry Classification Standard (GICS®). https://us.spindices.com/indices |


