


 Our Leadership Team
 Find An Advisor
 Our Platform
 Advisory
 Alternatives
 Insurance
 Specialized Services
 Individual Investors
 Retirees
 Business Owners
 Family Offices & Institutions
 Doctors
 Tenants
 Accountants
Weekly Market Commentary
The First Quarter Ended With Gains
Posted on April 2, 2024
The Major Markets saw mostly higher performance with only the Nasdaq failing to close the week higher. At the close of the week, the first quarter ended with gains in all five indices with the S&P 500 standing over 10% higher year to date.
For the S&P 500, this was the best first quarter since 2019. Furthermore, this stood as one of five first quarters that exceeded 10% in the last twenty years. The March performance also took the index to its fifth consecutive month of gains.
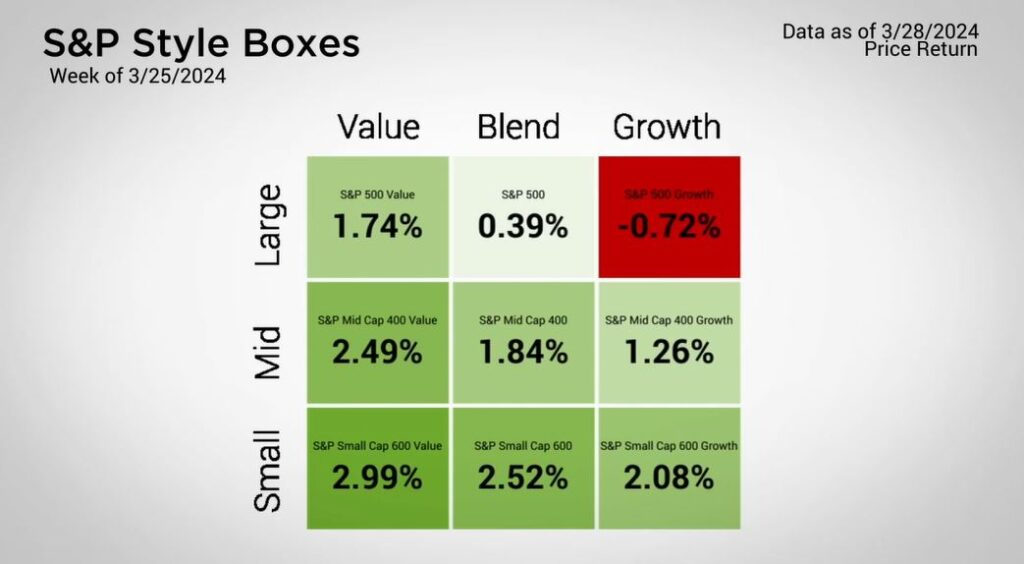
Last week’s gains were even more pronounced in the small cap segments. Small Cap Value added 3%, serving as the top performer across the style boxes. These gains helped to offset the earlier losses year to date. However, Small cap Value continues to struggle relative to other capitalizations for Q1.
For the S&P 500 Sectors, the performance was mostly positive with Communication services and Information Technology falling for the week. It was largely this reason why the Nasdaq closed the week lower. That said, those same two sectors remain in the top three performance spots year to date.
Major Markets |
YTD as of 03/29/2024 | ||
| Nasdaq |  |
||
| Dow Jones Industrial |  |
||
| S&P 500 |  |
||
| MSCI World |  |
||
| MSCI EM |  |
||
| Russell 2000 |  |
||
| Bar US Agg Bnd |  |
||
 |
|||
S&P Sectors |
|
|||||
| Comm. Services |  |
|||||
| Cons. Discretionary |  |
|||||
| Cons. Staples |  |
|||||
| Energy |  |
|||||
| Financials |  |
|||||
| Health Care |  |
|||||
| Industrials |  |
|||||
| Info. Technology |  |
|||||
| Materials |  |
|||||
| Real Estate |  |
|||||
| Utilities |  |
|||||
 |
||||||
| Agent/Broker Dealer Use Only | ||||||
Last week’s holiday shortened trading week did little to offer much in the way of movement in the treasury market. The curve remained relatively unchanged for the week and truly for the month of March as well.
Yet, market participants had hoped to see the first rate cut by the FOMC going into this year. With the yield curve remaining elevated compared to the end of December, this has caused the bond market to see red across various types of bond indices year to date.
It’s tax season, and each year scammers try to take advantage of unsuspecting individuals. Check out our report on protecting your wealth.
| The S&P 500® Index is a capitalization index of 500 stock-designed to measure performance of the broad domestic economy through changes in the aggregate market value of stock representing all major industries. https://us.spindices.com/indices/equity/sp-500 The Dow Jones Industrial Average® (The Dow®), is a price-weighted measure of 30 U.S. blue-chip companies. The index covers all industries except transportation and utilities. https://us.spindices.com/indices/equity/dow-jones-industrial-average The NASDAQ Composite Index measures all NASDAQ domestic and international based common type stocks listed on The NASDAQ Stock Market. Today the NASDAQ Composite includes over 2,500 companies, more than most other stock market indexes. Because it is so broad-based, the Composite is one of the most widely followed and quoted major market indexes. https://indexes.nasdaqomx.com/Index/Overview/COMP The MSCI World Index, which is part of The Modern Index Strategy, is a broad global equity benchmark that represents large and mid-cap equity performance across 23 developed markets countries. It covers approximately 85% of the free float-adjusted market capitalization in each country and MSCI World benchmark does not offer exposure to emerging markets. The MSCI Emerging Markets (EM) Index is designed to represent the performance of large- and mid-cap securities in 24 Emerging Markets countries of the Americas, Europe, the Middle East, Africa and Asia. As of December 2017, it had more than 830 constituents and covered approximately 85% of the free float-adjusted market capitalization in each country. https://www.msci.com/ The S&P GSCI Crude Oil index provides investors with a reliable and publicly available benchmark for investment performance in the crude oil market. https://us.spindices.com/indices Companies in the S&P 500 Sector Indices are classified based on the Global Industry Classification Standard (GICS®). https://us.spindices.com/indices |


