


 Our Leadership Team
 Find An Advisor
 Our Platform
 Advisory
 Alternatives
 Insurance
 Specialized Services
 Individual Investors
 Retirees
 Business Owners
 Family Offices & Institutions
 Doctors
 Tenants
 Accountants
 RIA / Advisor Firms
Weekly Market Commentary
Crude Oil Continued to Climb Higher
Posted on September 18, 2023
Market Commentary by Mitchell Wood, Larson COO
| The Major Markets closed the week mixed with the greatest gains found globally. The lackluster returns stateside was most noticeable within the tech space. While the Nasdaq composite managed to end only slightly lower on the week, the sector breakdown of the S&P 500 showed the weakness that dragged on the market. Big tech names like Apple, Adobe, and Netflix all saw significant pullbacks which reverberated across the indices. These names contributed to the pullback in the growth segment of the large cap sector, which managed to register the greatest losses among the aimless performance of the style boxes. |
| The outsized losses of the tech segment pulled on the overall S&P 500, contributing to its weekly losses. While two other sectors also closed the week lower, the losses in Materials and Industrials didn’t compare to the declines in IT. The remaining eight sectors closed higher. |
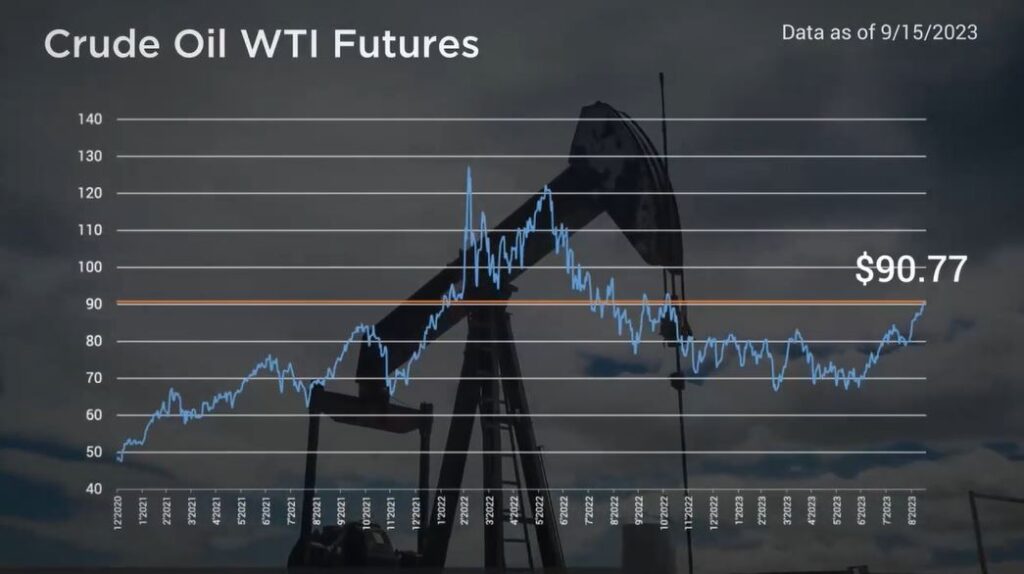
In commodities, Crude Oil continued to climb higher, back toward the trailing 12-month high.
| The price per barrel of WTI Crude Oil Futures closed the week at $90.77. This continued rise in oil prices worried some market analysts as energy prices are a significant component of the Consumer Price Index. Meanwhile, Wednesday saw the release of the August Consumer Price index which came in slightly higher than expected year-over-year with the headline reading of 3.7 percent. Finally, the continued inflationary concerns kept upward pressure on the yield curve. Treasuries saw a slight rise in the longer-term duration which pulled on bond performance. The Bloomberg Barclays Aggregate bond index fell a third of a percent to take the year-to-date gains back down to a quarter of one percent. |
Time for a financial checkup?
Click “Schedule a Consult” and get in touch today.
| The S&P 500® Index is a capitalization index of 500 stock-designed to measure performance of the broad domestic economy through changes in the aggregate market value of stock representing all major industries. https://us.spindices.com/indices/equity/sp-500 The Dow Jones Industrial Average® (The Dow®), is a price-weighted measure of 30 U.S. blue-chip companies. The index covers all industries except transportation and utilities. https://us.spindices.com/indices/equity/dow-jones-industrial-average The NASDAQ Composite Index measures all NASDAQ domestic and international based common type stocks listed on The NASDAQ Stock Market. Today the NASDAQ Composite includes over 2,500 companies, more than most other stock market indexes. Because it is so broad-based, the Composite is one of the most widely followed and quoted major market indexes. https://indexes.nasdaqomx.com/Index/Overview/COMP The MSCI World Index, which is part of The Modern Index Strategy, is a broad global equity benchmark that represents large and mid-cap equity performance across 23 developed markets countries. It covers approximately 85% of the free float-adjusted market capitalization in each country and MSCI World benchmark does not offer exposure to emerging markets. The MSCI Emerging Markets (EM) Index is designed to represent the performance of large- and mid-cap securities in 24 Emerging Markets countries of the Americas, Europe, the Middle East, Africa and Asia. As of December 2017, it had more than 830 constituents and covered approximately 85% of the free float-adjusted market capitalization in each country. https://www.msci.com/ The S&P GSCI Crude Oil index provides investors with a reliable and publicly available benchmark for investment performance in the crude oil market. https://us.spindices.com/indices Companies in the S&P 500 Sector Indices are classified based on the Global Industry Classification Standard (GICS®). https://us.spindices.com/indices |


