


 Our Leadership Team
 Find An Advisor
 Our Platform
 Advisory
 Alternatives
 Insurance
 Specialized Services
 Individual Investors
 Retirees
 Business Owners
 Family Offices & Institutions
 Doctors
 Tenants
 Accountants
Weekly Market Commentary
Conflict in the Middle East
Posted on October 16, 2023
Market Commentary by Mitchell Wood, Larson COO
| The Major Markets closed out the week without much of a fright on Friday the 13th. The Nasdaq surprisingly was the lone segment in negative territory last week, while the other four indices closed higher. But it wasn’t the domestic markets that caused the greatest scare. Investors walked into work Monday taking in the new from overseas of the terrorist attack by Hamas on Israel and the fallout the ensued. |
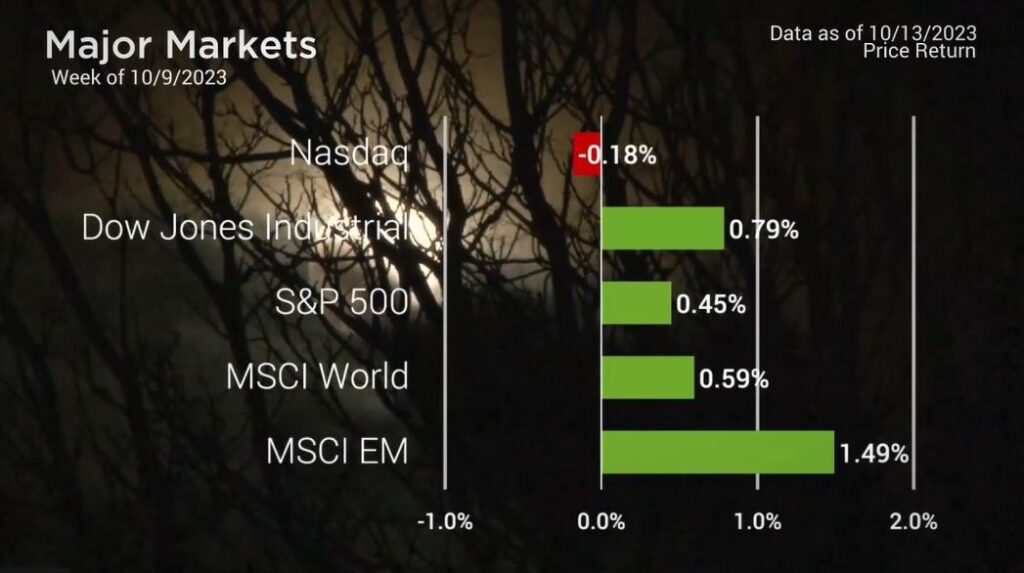
Major Markets |
YTD as of 10/13/2023 | ||
| Nasdaq |  |
||
| Dow Jones Industrial |  |
||
| S&P 500 |  |
||
| MSCI World |  |
||
| MSCI EM |  |
||
| Russell 2000 |  |
||
| Bar US Agg Bnd |  |
||
 |
|||
S&P Sectors |
|
|||||
| Comm. Services |  |
|||||
| Cons. Discretionary |  |
|||||
| Cons. Staples |  |
|||||
| Energy |  |
|||||
| Financials |  |
|||||
| Health Care |  |
|||||
| Industrials |  |
|||||
| Info. Technology |  |
|||||
| Materials |  |
|||||
| Real Estate |  |
|||||
| Utilities |  |
|||||
 |
||||||
| Agent/Broker Dealer Use Only | ||||||
| By Friday, threats were made globally around the “Day of Rage” for Friday the 13th that saw regions both domestic and foreign have pro-Palestine demonstrations. |
Despite the threats, no material terrorist attack played out stateside.
| In the end, the geopolitical attention seemed to shift away from the war in Ukraine and onto the conflict in the middle east. The most noticeable economic fallout was seen in WTI Crude Oil Futures. Prices spiked back up beyond $87 a barrel on Monday but seemed to drift slightly lower from there. Not surprisingly, this led to some gains in the Energy sector as this segment, followed by Utilities and Real Estate, added the only real significant gains for the week. On the economic front, Tuesday saw the release of the September Producer Price Index which came in hotter than expected with a monthly reading of 0.5 percent and a year-over-year increase of 2.2 percent, significantly exceeding the 1.6 percent year-over-year result from August. This was echoed on Thursday as the Consumer Price Index also came in hotter than expected. While the monthly change did see a slight decline, the year-over-year reading held at 3.7 percent. Treasuries absorbed all this news and closed out the week with a slight decrease in the tail end of the yield curve. https://abcnews.go.com/International/hamas-day-rage-protests-break-middle-east/story?id=103955873# |
Time for a financial checkup?
Click “Schedule a Consult” and get in touch today.
| The S&P 500® Index is a capitalization index of 500 stock-designed to measure performance of the broad domestic economy through changes in the aggregate market value of stock representing all major industries. https://us.spindices.com/indices/equity/sp-500 The Dow Jones Industrial Average® (The Dow®), is a price-weighted measure of 30 U.S. blue-chip companies. The index covers all industries except transportation and utilities. https://us.spindices.com/indices/equity/dow-jones-industrial-average The NASDAQ Composite Index measures all NASDAQ domestic and international based common type stocks listed on The NASDAQ Stock Market. Today the NASDAQ Composite includes over 2,500 companies, more than most other stock market indexes. Because it is so broad-based, the Composite is one of the most widely followed and quoted major market indexes. https://indexes.nasdaqomx.com/Index/Overview/COMP The MSCI World Index, which is part of The Modern Index Strategy, is a broad global equity benchmark that represents large and mid-cap equity performance across 23 developed markets countries. It covers approximately 85% of the free float-adjusted market capitalization in each country and MSCI World benchmark does not offer exposure to emerging markets. The MSCI Emerging Markets (EM) Index is designed to represent the performance of large- and mid-cap securities in 24 Emerging Markets countries of the Americas, Europe, the Middle East, Africa and Asia. As of December 2017, it had more than 830 constituents and covered approximately 85% of the free float-adjusted market capitalization in each country. https://www.msci.com/ The S&P GSCI Crude Oil index provides investors with a reliable and publicly available benchmark for investment performance in the crude oil market. https://us.spindices.com/indices Companies in the S&P 500 Sector Indices are classified based on the Global Industry Classification Standard (GICS®). https://us.spindices.com/indices |


