


 Our Leadership Team
 Find An Advisor
 Our Platform
 Advisory
 Alternatives
 Insurance
 Specialized Services
 Individual Investors
 Retirees
 Business Owners
 Family Offices & Institutions
 Doctors
 Tenants
 Accountants
 RIA / Advisor Firms
Weekly Market Commentary
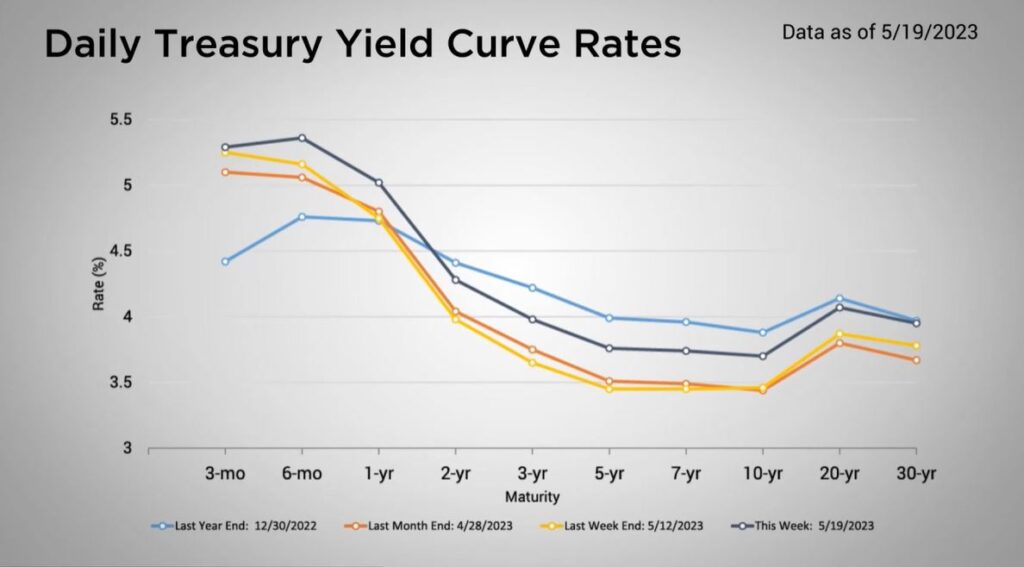
An Increase in the Yield Curve
Posted on May 24, 2023
Market Commentary by Mitchell Wood, Larson COO
| The Major Markets closed higher across the board last week. How significant those gains were, did vary from one index to another. The Nasdaq returned to the top position as it added over three percent last week. This pushed the Nasdaq to a year-to-date return over 20 percent as of Friday. The nine percent year-to-date return for the S&P 500 was the result of the blue-chip index exceeding the 4200 level for the first time this year. Going back to the lows of October, the S&P 500 climbed over 20 percent as the index has been retracing the drawdowns from the January 2022 all-time highs. As good as the returns were for the equity market, the bond market wasn’t as fortunate. The Bloomberg Barclays Aggregate Bond Index experienced its third largest weekly decline this year. |
The drop in performance of the broad bond indices was the result of an increase in the yield curve.
| Interest rates rose last week as concerns about future Fed Funds Rate increases began to stir. James Bullard, president of the Federal Reserve Bank of St. Louis stated Friday that he would be open to an additional 25 basis point increase during the June FOMC Meeting. Earlier in the week, some members of the Federal Reserve testified before the Senate regarding the oversight of the banking sector given the recent bank failures and lending stresses. In the end, Fed Chairman Jerome Powell backed away from the more hawkish statements Friday when he said, “The financial stability tools helped to calm conditions in the banking sector. Developments there, on the other hand, are contributing to tighter credit conditions and are likely to weigh on economic growth, hiring and inflation…” “So as a result, our policy rate may not need to rise as much as it would have otherwise to achieve our goals.” |
| Looking ahead, the Markets will need to navigate the interest rate and banking environment that is layered on top of the stalled negotiations around the debt ceiling in Washington D.C. https://www.ft.com/content/0031bfc1-b8d8-4c2e-b827-b23ae06764f4 https://www.youtube.com/watch?v=5lQ2YCvTGCQ https://www.cnbc.com/2023/05/19/fed-chair-powell-says-rates-may-not-have-to-rise-as-much-as-expected-to-curb-inflation.html https://www.cnn.com/2023/05/19/politics/debt-limit-talks-snag/index.html |
Are you on track to reach your financial goals?
Click “Schedule a Consult” to set up an appointment with your advisor.
| The S&P 500® Index is a capitalization index of 500 stock-designed to measure performance of the broad domestic economy through changes in the aggregate market value of stock representing all major industries. https://us.spindices.com/indices/equity/sp-500 The Dow Jones Industrial Average® (The Dow®), is a price-weighted measure of 30 U.S. blue-chip companies. The index covers all industries except transportation and utilities. https://us.spindices.com/indices/equity/dow-jones-industrial-average The NASDAQ Composite Index measures all NASDAQ domestic and international based common type stocks listed on The NASDAQ Stock Market. Today the NASDAQ Composite includes over 2,500 companies, more than most other stock market indexes. Because it is so broad-based, the Composite is one of the most widely followed and quoted major market indexes. https://indexes.nasdaqomx.com/Index/Overview/COMP The MSCI World Index, which is part of The Modern Index Strategy, is a broad global equity benchmark that represents large and mid-cap equity performance across 23 developed markets countries. It covers approximately 85% of the free float-adjusted market capitalization in each country and MSCI World benchmark does not offer exposure to emerging markets. The MSCI Emerging Markets (EM) Index is designed to represent the performance of large- and mid-cap securities in 24 Emerging Markets countries of the Americas, Europe, the Middle East, Africa and Asia. As of December 2017, it had more than 830 constituents and covered approximately 85% of the free float-adjusted market capitalization in each country. https://www.msci.com/ The S&P GSCI Crude Oil index provides investors with a reliable and publicly available benchmark for investment performance in the crude oil market. https://us.spindices.com/indices Companies in the S&P 500 Sector Indices are classified based on the Global Industry Classification Standard (GICS®). https://us.spindices.com/indices |


