


 Our Leadership Team
 Find An Advisor
 Our Platform
 Advisory
 Alternatives
 Insurance
 Specialized Services
 Individual Investors
 Retirees
 Business Owners
 Family Offices & Institutions
 Doctors
 Tenants
 Accountants
 RIA / Advisor Firms
Weekly Market Commentary
All Five Indices Ended Lower
Posted on September 11, 2023
Market Commentary by Mitchell Wood, Larson COO
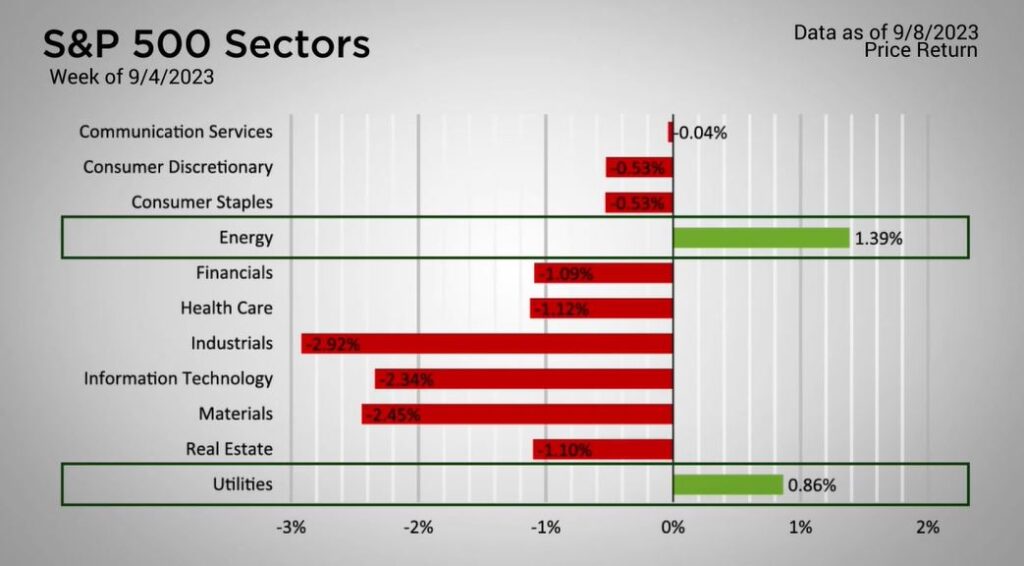
| The holiday shortened trading week didn’t provide much relief to the Major Markets last week. All five indices ended lower. There wasn’t even a safe segment across the style boxes. The S&P 500 Value index managed to see the smallest decline. Yet the benefit of the value posturing didn’t translate to the mid-cap and small cap capitalizations. At the sector level, only two segments managed to close higher. These were Energy and Utilities. These two somewhat related sectors were fueled by gains in Crude Oil as the GSCI Crude Oil Index rose another 2.4 percent for the week. |
| The movement in crude was largely the result of a midweek announcement that both Russia and China would be continuing their voluntary oil production cut through the end of 2023. |
This would reduce the global crude output by 1.3 million barrels.
| This event fueled the concerns of persistent inflation. However, while CME Group’s FedWatch Tool saw an uptick in the probability of another interest rate increase at the December FOMC meeting, this only took the odds back toward the mid-week high of the last week of August. Finally, Treasuries climbed modestly higher within the short and intermediate term durations. The largest increase was within the 2-to-3-year yields. This caused the Bond Indices to drop once again, as the Bloomberg Barclays Aggregate Bond Index fell about a third of a percent. https://apnews.com/article/saudi-arabia-oil-production-cut-opec-2d6f724e899f31e92d4bdf052921125c |
Time for a financial checkup?
Click “Schedule a Consult” and get in touch today.
| The S&P 500® Index is a capitalization index of 500 stock-designed to measure performance of the broad domestic economy through changes in the aggregate market value of stock representing all major industries. https://us.spindices.com/indices/equity/sp-500 The Dow Jones Industrial Average® (The Dow®), is a price-weighted measure of 30 U.S. blue-chip companies. The index covers all industries except transportation and utilities. https://us.spindices.com/indices/equity/dow-jones-industrial-average The NASDAQ Composite Index measures all NASDAQ domestic and international based common type stocks listed on The NASDAQ Stock Market. Today the NASDAQ Composite includes over 2,500 companies, more than most other stock market indexes. Because it is so broad-based, the Composite is one of the most widely followed and quoted major market indexes. https://indexes.nasdaqomx.com/Index/Overview/COMP The MSCI World Index, which is part of The Modern Index Strategy, is a broad global equity benchmark that represents large and mid-cap equity performance across 23 developed markets countries. It covers approximately 85% of the free float-adjusted market capitalization in each country and MSCI World benchmark does not offer exposure to emerging markets. The MSCI Emerging Markets (EM) Index is designed to represent the performance of large- and mid-cap securities in 24 Emerging Markets countries of the Americas, Europe, the Middle East, Africa and Asia. As of December 2017, it had more than 830 constituents and covered approximately 85% of the free float-adjusted market capitalization in each country. https://www.msci.com/ The S&P GSCI Crude Oil index provides investors with a reliable and publicly available benchmark for investment performance in the crude oil market. https://us.spindices.com/indices Companies in the S&P 500 Sector Indices are classified based on the Global Industry Classification Standard (GICS®). https://us.spindices.com/indices |


