


 Our Leadership Team
 Find An Advisor
 Our Platform
 Advisory
 Alternatives
 Insurance
 Specialized Services
 Individual Investors
 Retirees
 Business Owners
 Family Offices & Institutions
 Doctors
 Tenants
 Accountants
Weekly Market Commentary
All Five Indices Ended Lower
Posted on October 2, 2023
Market Commentary by Mitchell Wood, Larson COO
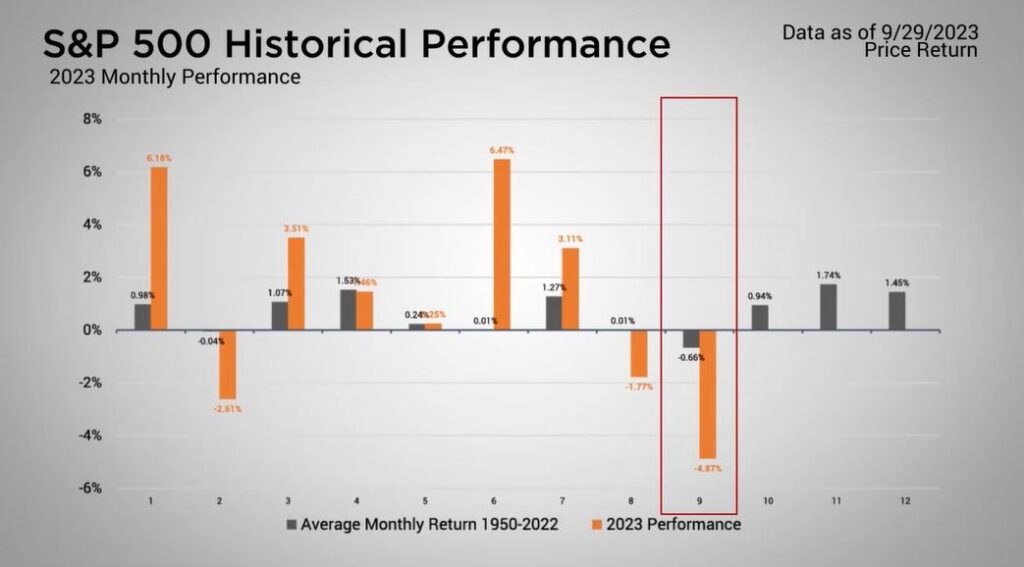
| The final week of September (and consequently the quarter) ended mostly lower. The Dow Jones Industrial Average marked the greatest loss, followed not too far by the MSCI Emerging Markets along with the rest of the Major Markets. The one holdout in positive territory was the Nasdaq, which managed to eke out a slight gain for the week. Nevertheless, the losses mounted last month as all five indices ended lower for September. The nearly five percent loss in the S&P 500 locked in the greatest monthly loss for the year. |
Major Markets |
YTD as of 9/29/2023 | ||
| Nasdaq |  |
||
| Dow Jones Industrial |  |
||
| S&P 500 |  |
||
| MSCI World |  |
||
| MSCI EM |  |
||
| Russell 2000 |  |
||
| Bar US Agg Bnd |  |
||
 |
|||
S&P Sectors |
|
|||||
| Comm. Services |  |
|||||
| Cons. Discretionary |  |
|||||
| Cons. Staples |  |
|||||
| Energy |  |
|||||
| Financials |  |
|||||
| Health Care |  |
|||||
| Industrials |  |
|||||
| Info. Technology |  |
|||||
| Materials |  |
|||||
| Real Estate |  |
|||||
| Utilities |  |
|||||
 |
||||||
| Agent/Broker Dealer Use Only | ||||||
At the end of Q3, the Nasdaq still manages to sit with an impressive 26 percent return while the S&P 500 is the only other Major Market with a double-digit return. The Dow Jones’ limited exposure to Technology and Consumer Discretionary names has caused the index to underperform relative to the Nasdaq and S&P 500 which both have more significant weights to those segments. |
This difference in performance is far more visible at the sector level.
| Even though half the names are positive, the performance in Communication Services, Information Technology, and Consumer Discretionary is many times that of Energy, Industrials, and Materials this year. Presently, the market’s attention continues to be fixated on interest rates. Treasuries saw the yield curve flatten as the longer end of the yield curve rose higher. After the last FOMC Meeting, the probabilities for future rate increases have largely stalled with the greater probability for the Fed Funds Rate to hold at the present 525-550 basis point range for the better part of the next year. Economic Data has largely gone unnoticed by the markets for some time. This week, economists will have a chance to see the initial September Employment results on Friday. This, along with the following week’s CPI results, continue to be some of the most significant economic reports that the Fed has been discussing. A decline in these economic reports would signal the beginning of rates receding from their current elevated levels. |
Time for a financial checkup?
Click “Schedule a Consult” and get in touch today.
| The S&P 500® Index is a capitalization index of 500 stock-designed to measure performance of the broad domestic economy through changes in the aggregate market value of stock representing all major industries. https://us.spindices.com/indices/equity/sp-500 The Dow Jones Industrial Average® (The Dow®), is a price-weighted measure of 30 U.S. blue-chip companies. The index covers all industries except transportation and utilities. https://us.spindices.com/indices/equity/dow-jones-industrial-average The NASDAQ Composite Index measures all NASDAQ domestic and international based common type stocks listed on The NASDAQ Stock Market. Today the NASDAQ Composite includes over 2,500 companies, more than most other stock market indexes. Because it is so broad-based, the Composite is one of the most widely followed and quoted major market indexes. https://indexes.nasdaqomx.com/Index/Overview/COMP The MSCI World Index, which is part of The Modern Index Strategy, is a broad global equity benchmark that represents large and mid-cap equity performance across 23 developed markets countries. It covers approximately 85% of the free float-adjusted market capitalization in each country and MSCI World benchmark does not offer exposure to emerging markets. The MSCI Emerging Markets (EM) Index is designed to represent the performance of large- and mid-cap securities in 24 Emerging Markets countries of the Americas, Europe, the Middle East, Africa and Asia. As of December 2017, it had more than 830 constituents and covered approximately 85% of the free float-adjusted market capitalization in each country. https://www.msci.com/ The S&P GSCI Crude Oil index provides investors with a reliable and publicly available benchmark for investment performance in the crude oil market. https://us.spindices.com/indices Companies in the S&P 500 Sector Indices are classified based on the Global Industry Classification Standard (GICS®). https://us.spindices.com/indices |


