


 Our Leadership Team
 Find An Advisor
 Our Platform
 Advisory
 Alternatives
 Insurance
 Specialized Services
 Individual Investors
 Retirees
 Business Owners
 Family Offices & Institutions
 Doctors
 Tenants
 Accountants
 RIA / Advisor Firms
Weekly Market Commentary
All Five Indices Closed Lower
Posted on August 21, 2023
Market Commentary by Mitchell Wood, Larson COO
| The dog days of summer saw the equity markets melt under the heat as all five indices closed lower. This marked the third week of declines for the S&P 500. While the S&P 500 has managed to reach a new high-water mark for the year in August, only 3 of the 14 trading days this month have ended positive. The selling pressure caused the index to fall below its 50-day moving average this week, for the first time since March. The selling was consistent across the style boxes and the sector breakdowns as market participants continued to evaluate their exposure to equities since the run-up that began in mid-March. |
While the equity market saw falling index values, Treasuries were rising.
| Durations longer than 2-year saw yields increase with the 30-year adding 11 basis points. The impact of rising rates resulted in losses in the Bond markets. The Bloomberg Barclays Aggregate Bond index fell another 50 basis points, dropping the year-to-date gains back to just above flat. |
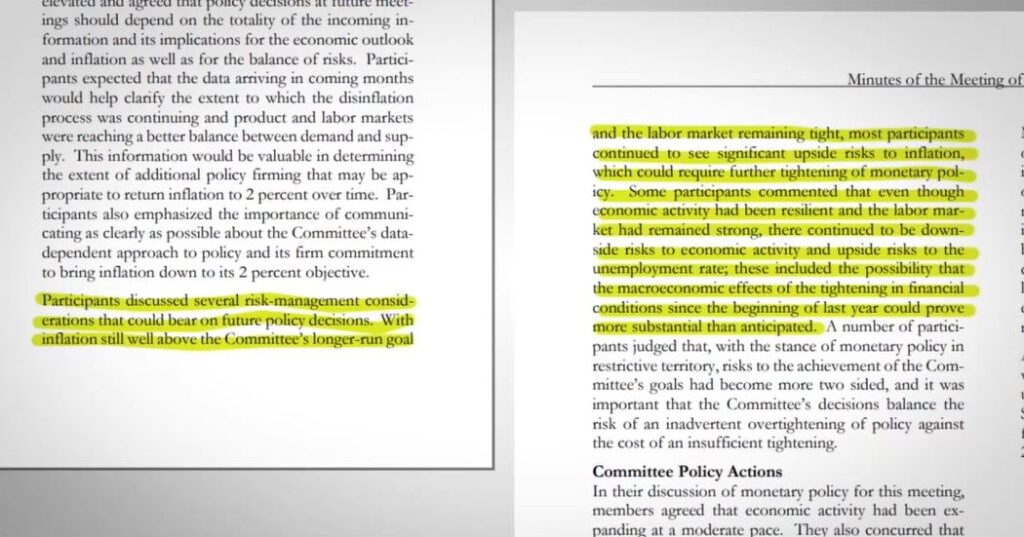
| Persistent inflation concerns loomed over the market with the release of July’s FOMC Minutes. In the document, the Fed wrote: “Participants discussed several risk-management considerations that could bear on future policy decisions. With inflation still well above the Committee’s longer-run goal and the labor market remaining tight, most participants continued to see significant upside risks to inflation, which could require further tightening of monetary policy. Some participants commented that even though economic activity had been resilient and the labor market had remained strong, there continued to be downside risks to economic activity and upside risks to the unemployment rate; these included the possibility that the macroeconomic effects of the tightening in financial conditions since the beginning of last year could prove more substantial than anticipated.” Nevertheless, the CME Group’s Fed Watch Tool still shows the greatest likelihood that rates will peak at the present 525-550 bps range for this tightening cycle. https://www.federalreserve.gov/monetarypolicy/files/fomcminutes20230726.pdf |
Have a question for your advisor?
Click “Schedule a Consult” and get in touch today.
| The S&P 500® Index is a capitalization index of 500 stock-designed to measure performance of the broad domestic economy through changes in the aggregate market value of stock representing all major industries. https://us.spindices.com/indices/equity/sp-500 The Dow Jones Industrial Average® (The Dow®), is a price-weighted measure of 30 U.S. blue-chip companies. The index covers all industries except transportation and utilities. https://us.spindices.com/indices/equity/dow-jones-industrial-average The NASDAQ Composite Index measures all NASDAQ domestic and international based common type stocks listed on The NASDAQ Stock Market. Today the NASDAQ Composite includes over 2,500 companies, more than most other stock market indexes. Because it is so broad-based, the Composite is one of the most widely followed and quoted major market indexes. https://indexes.nasdaqomx.com/Index/Overview/COMP The MSCI World Index, which is part of The Modern Index Strategy, is a broad global equity benchmark that represents large and mid-cap equity performance across 23 developed markets countries. It covers approximately 85% of the free float-adjusted market capitalization in each country and MSCI World benchmark does not offer exposure to emerging markets. The MSCI Emerging Markets (EM) Index is designed to represent the performance of large- and mid-cap securities in 24 Emerging Markets countries of the Americas, Europe, the Middle East, Africa and Asia. As of December 2017, it had more than 830 constituents and covered approximately 85% of the free float-adjusted market capitalization in each country. https://www.msci.com/ The S&P GSCI Crude Oil index provides investors with a reliable and publicly available benchmark for investment performance in the crude oil market. https://us.spindices.com/indices Companies in the S&P 500 Sector Indices are classified based on the Global Industry Classification Standard (GICS®). https://us.spindices.com/indices |


