


 Our Leadership Team
 Find An Advisor
 Our Platform
 Advisory
 Alternatives
 Insurance
 Specialized Services
 Individual Investors
 Retirees
 Business Owners
 Family Offices & Institutions
 Doctors
 Tenants
 Accountants
 RIA / Advisor Firms
Weekly Market Commentary
A Downgrade from AAA to AA+
Posted on August 7, 2023
Market Commentary by Mitchell Wood, Larson COO
| The Major Markets felt the heat last week as all five indices closed lower. While the Nasdaq fell the greatest, Emerging Markets, the MSCI World index, and even the S&P 500 were not too far behind. Last week began with the conclusion to the month of July. July marked the fifth consecutive month of green for the S&P 500. So far, only February has seen a monthly decline for 2023. That said, the month of August didn’t begin with a great start. The first session of the month closed slightly lower. But after market close, the Fitch Rating agency announced the downgrade of the United States from AAA to AA+. |
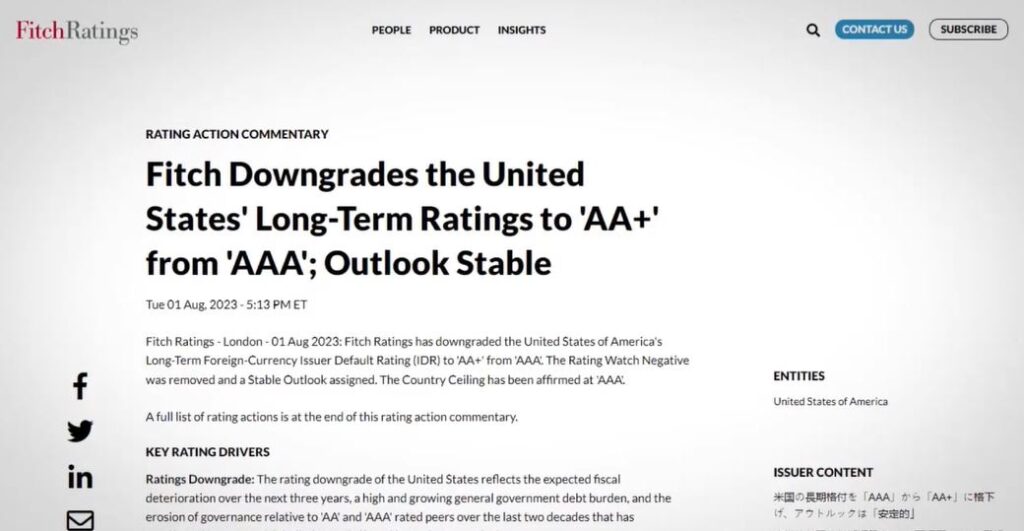
| Fitch highlighted the key drivers for the downgrade which included: “…the expected fiscal deterioration over the next three years, a high and growing general government debt burden, and the erosion of governance relative to ‘AA’ and ‘AAA’ rated peers over the last two decades that has manifested in repeated debt limit standoffs and last-minute resolutions.” Additionally, the agency highlighted the growth in the general governmental deficit relative to the GDP as well as the challenges that servicing higher interest rates on that debt will have on the country. This news, combined with a significant beat in the headline ADP report which saw 324,000 private-sector jobs added during a time when the Fed is pushing for labor market contraction, weighed heavily on the markets. |
As a result, the S&P 500 saw its largest daily decline since April.
| The Fitch Rating agency was criticized by many in Washington and on Wall Street. Treasury Secretary Janet Yellen called the downgrade “arbitrary” and “outdated”, despite the July 13th US Treasury Report which posted a $228B deficit which was a 156 percent year-over-year increase. The July BLS Non-Farm payroll report helped to temper the bullish feelings about the economy as the headline number missed expectations. As the week drew to a close, yields ended largely unchanged on the developments of the week, with the seven-to-thirty-year durations climbing slightly higher for the week while the shorter end of the curve shaved off a few basis points. https://www.fitchratings.com/research/sovereigns/fitch-downgrades-united-states-long-term-ratings-to-aa-from-aaa-outlook-stable-01-08-2023 https://www.reuters.com/markets/us/fitch-cuts-us-governments-aaa-credit-rating-by-one-notch-2023-08-01/ https://www.reuters.com/markets/us/us-treasury-posts-sharply-higher-228-billion-june-deficit-2023-07-13/ |
Have a question for your advisor?
Click “Schedule a Consult” and get in touch today.
| The S&P 500® Index is a capitalization index of 500 stock-designed to measure performance of the broad domestic economy through changes in the aggregate market value of stock representing all major industries. https://us.spindices.com/indices/equity/sp-500 The Dow Jones Industrial Average® (The Dow®), is a price-weighted measure of 30 U.S. blue-chip companies. The index covers all industries except transportation and utilities. https://us.spindices.com/indices/equity/dow-jones-industrial-average The NASDAQ Composite Index measures all NASDAQ domestic and international based common type stocks listed on The NASDAQ Stock Market. Today the NASDAQ Composite includes over 2,500 companies, more than most other stock market indexes. Because it is so broad-based, the Composite is one of the most widely followed and quoted major market indexes. https://indexes.nasdaqomx.com/Index/Overview/COMP The MSCI World Index, which is part of The Modern Index Strategy, is a broad global equity benchmark that represents large and mid-cap equity performance across 23 developed markets countries. It covers approximately 85% of the free float-adjusted market capitalization in each country and MSCI World benchmark does not offer exposure to emerging markets. The MSCI Emerging Markets (EM) Index is designed to represent the performance of large- and mid-cap securities in 24 Emerging Markets countries of the Americas, Europe, the Middle East, Africa and Asia. As of December 2017, it had more than 830 constituents and covered approximately 85% of the free float-adjusted market capitalization in each country. https://www.msci.com/ The S&P GSCI Crude Oil index provides investors with a reliable and publicly available benchmark for investment performance in the crude oil market. https://us.spindices.com/indices Companies in the S&P 500 Sector Indices are classified based on the Global Industry Classification Standard (GICS®). https://us.spindices.com/indices |


